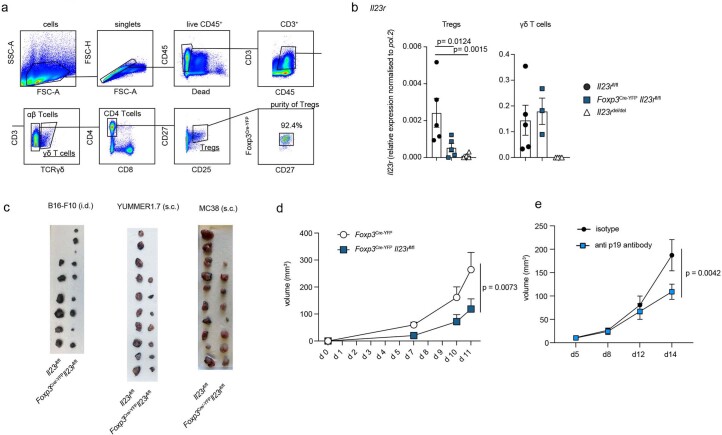
Extended Data Fig. 2. Treg cells mediate the tumor-promoting functions of IL-23.
(a) Gating strategy to FACS sort γδ T cells and Treg cells from LNs of Foxp3Cre-YFPIl23rfl/fl and Il23rfl/fl mice for qPCR and example plot showing purity of sorted Treg cells. (b) Bar graphs depicting relative mRNA expression level of Il23r normalized to pol.2 in FACS sorted γδ T cells and Treg cells from steady state LNs of Foxp3Cre-YFPIl23rfl/fl, Il23rfl/fl and Il23rdel/del mice. Data shown from one representative experiment out of two independent experiments with n = 5 (Foxp3Cre-YFPIl23rfl/fl and IL23Rfl/fl mice) or n = 3 (Il23rdel/del) biologically independent samples. Data are displayed as mean +/- SEM. Statistical significance was determined using t-tests. (c) Il23rfl/fl and Foxp3Cre-YFPIl23rfl/fl mice were inoculated i.d. with B16 tumor cells, inoculated s.c. with YUMMER1.7 tumor cells or inoculated s.c. with MC38 tumor cells. Tumors were analyzed on day 15, 14 or 24 post-inoculation. Pictures depict tumors after harvest. Data from 3 independent experiments with n = 6-10. (d) Kinetics of tumor volume measured by caliper gauge in B16 tumor cell-inoculated i.d. Foxp3Cre-YFP and Foxp3Cre-YFPIl23rfl/fl mice. Mean +/- SEM is displayed. Statistical significance was determined using 2-way Anovas. n = 4 biologically independent animals. (e) Kinetics of tumor volume measured by caliper gauge in MC38 tumor cell-inoculated s.c. C57Bl/6 mice i.p. injected either with anti-p19 blocking or isotype antibodies. n = 6 (isotype) and n = 7 (anti p19 antibody) biologically independent animals. Mean +/− SEM is displayed. Statistical significance was determined using 2-way Anovas.

