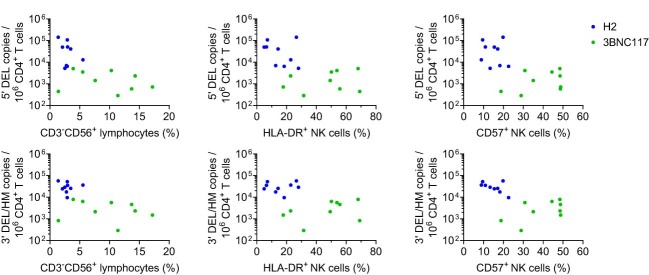
Extended Data Fig. 10. Comparisons between the frequencies of defective provirus+CD4+ T cells and NK cell activity in H2-Db- and 3BNC117-Db-treated hIL-15TgNSG mice.
Data reported as the percentage of CD3-CD56+ lymphocytes (left), percentage of HLA-DR+ NK cells (middle), and percentage of CD57+ NK cells (right) post-treatment (day 42) compared to the frequencies of CD4+ T cells harboring 5′ deleted (top) or 3′ deleted or hypermutated proviruses (bottom). H2-Db (n = 9); 3BNC117-Db (n = 9).

