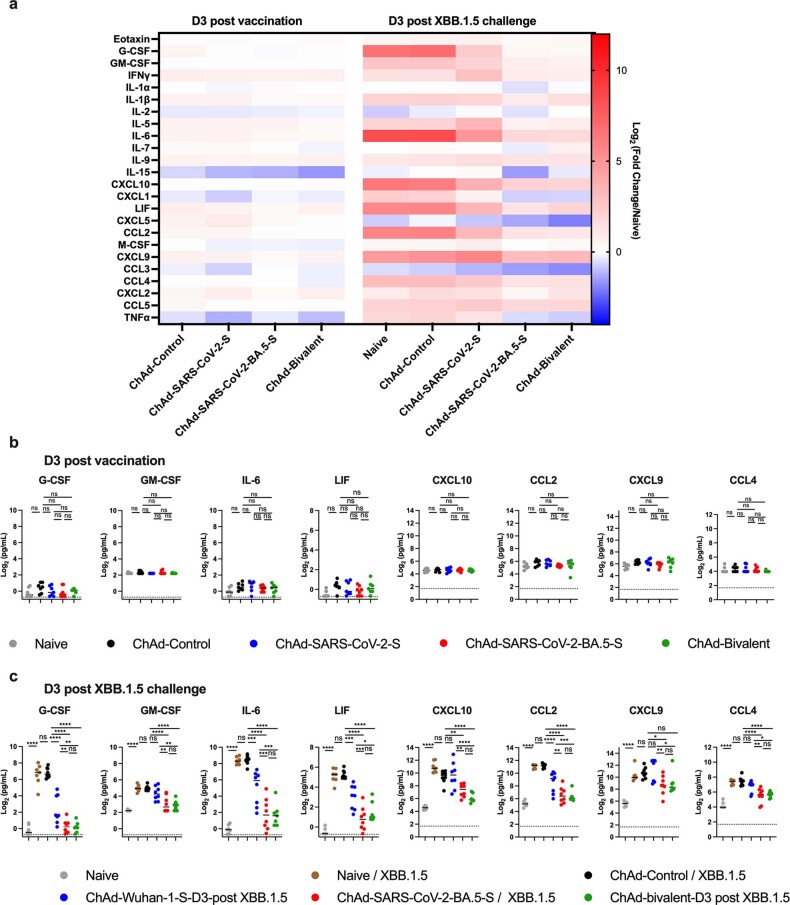
Extended Data Fig. 4. Cytokine and chemokine responses in the lungs of ChAd vaccinated and XBB.1.5-infected mice.
Seven to nine-week-old female K18-hACE2 mice were immunized IN with ChAd vaccines and challenged IN with 104 f.f.u. of XBB.1.5. (a) Heat maps of cytokine and chemokine levels in lung homogenates at 3 days after vaccination or 3 days after XBB.1.5 infection. Fold-change was calculated relative to naive uninfected mice, and log2 fold differences are presented. (b-c) Cytokine and chemokine concentrations (pg/mL) in lung homogenates 3 days after vaccination only (b, n = 7, 7, 7, 8, 7 (left-to-right)) and 3 days after challenge with XBB.1.5 (c, n = 7, 8, 8, 8, 7 (left-to-right)). Individual data points are from two experiments. Data also are shown in Supplementary Table 1. Statistical analysis: one-way ANOVA with a Tukey’s post hoc test (b-c): * P < 0.05, **P < 0.01, ***P < 0.001, ****P < 0.0001.

