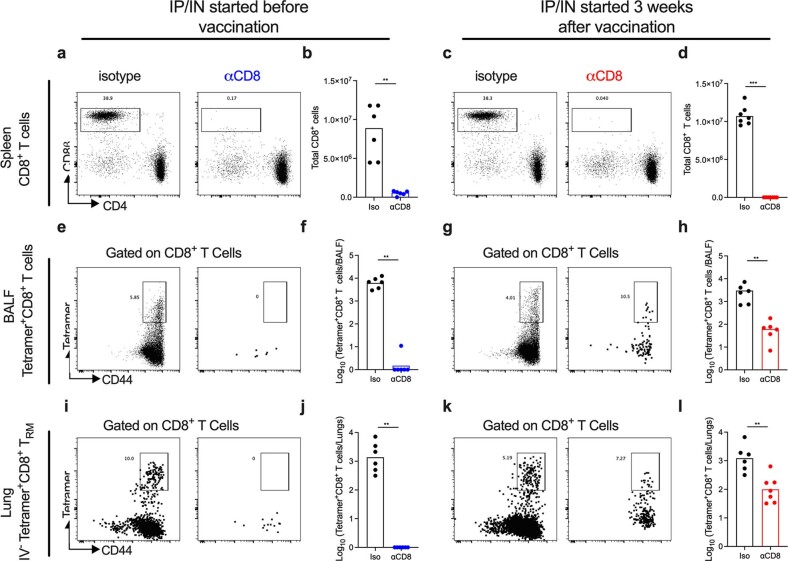
Extended Data Fig. 6. Depletion of CD8+ T cells in different tissue compartments.
Seven-week-old female K18-hACE2 mice were immunized via IN route with a single dose of ChAd-SARS-CoV-2-S vaccine and treated with anti-CD8 or isotype antibodies via different regimens: IP administration beginning one day before vaccination and every 4 days thereafter plus IN administration beginning at D-1 and D6 after vaccination and also given at days 26 and 29 (a-b, e-f, i-j); or IP and IN administration given 26 and 29 days after vaccination (c-d, g-h, k-l). On day 31 after immunization, spleens (a-d), BALF (e-h) and lungs (i-l) were analyzed by flow cytometry for CD8+ T cell and spike-tetramer+ cell frequencies and numbers. Representative scatter plots are shown (a, c, e, g, i, k) as well as total cell numbers (b, d, f, h, j, l). Data are from two experiments (b, n = 6; d, n = 7; f, n = 6; h, n = 6; j, n = 6; l, n = 6, 7 (left-to-right); boxes illustrate geometric mean values). Statistical analysis: one-way ANOVA with Tukey’s post-test: * P < 0.05, ∗∗ P < 0.01, ∗∗∗ P < 0.001, ∗∗∗∗ P < 0.0001.

