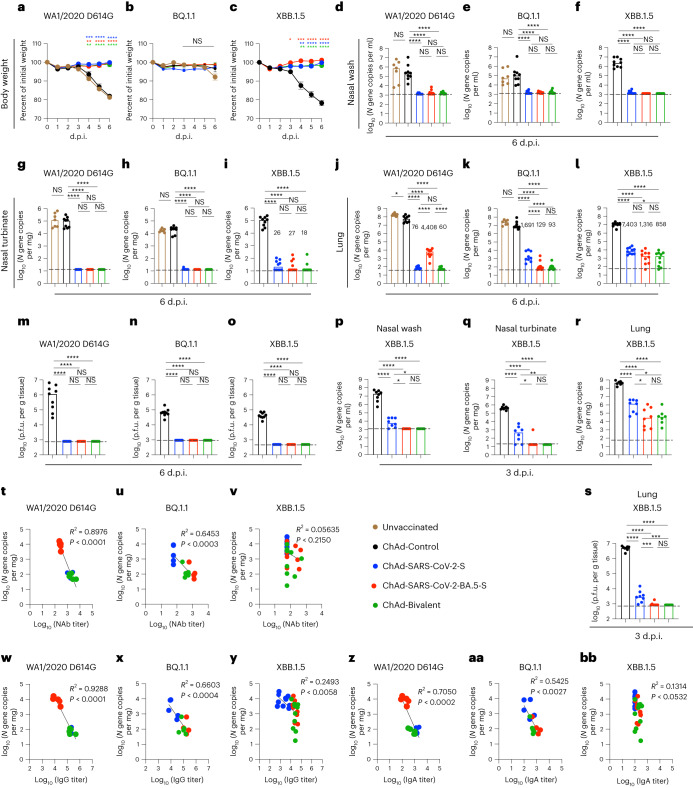
Fig. 4. ChAd vaccines protect mice against infection by ancestral and Omicron SARS-CoV-2 strains.
a–o, Seven- to 9-week-old female K18-hACE2 mice were immunized i.n. with 2 × 10⁹ viral particles of the indicated ChAd vaccines, as described in Fig. 1b. Eight weeks later, mice were challenged i.n. with 104 f.f.u. of SARS-CoV-2 WA1/2020 D614G, BQ.1.1 or XBB.1.5 (two experiments). a–c, Body weight was measured over time and the percent of the initial weight was determined (two experiments). Data are shown as mean ± s.e.m. (WA1/2020 D614G, n = 9 mice per group; BQ.1.1, n = 9, 9, 10 and 10; XBB.1.5, n = 9, 10, 9 and 10 (left to right: ChAd-Control, ChAd-SARS-CoV-2-S, ChAD-SARS-CoV-2-BA.5-S and bivalent ChAd)). d–l, Viral RNA levels were determined at 6 d.p.i. in nasal washes (d–f), nasal turbinates (g–i) and lungs (j–l; WA1/2020 D614G: n = 7, 9, 8, 9 and 9; BQ.1.1: n = 7, 9, 9, 10 and 10; XBB.1.5: n = 9, 10, 9 and 10 (all left to right)). m–o, Infectious virus levels in the lungs (WA1/2020 D614G: n = 9, 8, 9 and 9; BQ.1.1: n = 9, 9, 10 and 10; XBB.1.5: n = 9, 10, 10 and 10 (all left to right)). Boxes illustrate median values, and dotted lines indicate the LOD. p–s, Viral burden at 3 d.p.i. after XBB.1.5 challenge (n = 8, 8, 8 and 7 mice per group (left to right), two experiments). Viral RNA levels in nasal washes (p), nasal turbinates (q) and lungs (r) are shown as well as infectious virus levels in the lungs (s). t–bb, Correlation analyses are shown comparing lung viral RNA levels to serum neutralizing antibody (NAb) titers (t–v), IgG titers (w–y) and IgA titers (z–bb). Data were analyzed by two-way ANOVA with a Tukey’s post hoc test (a–c), one-way ANOVA with a Tukey’s post hoc test (d–s) or linear regression analysis, with P and R2 values indicated (t–bb); *P < 0.05, **P < 0.01, ***P < 0.001 and ****P < 0.0001.

