
Fig. 1.
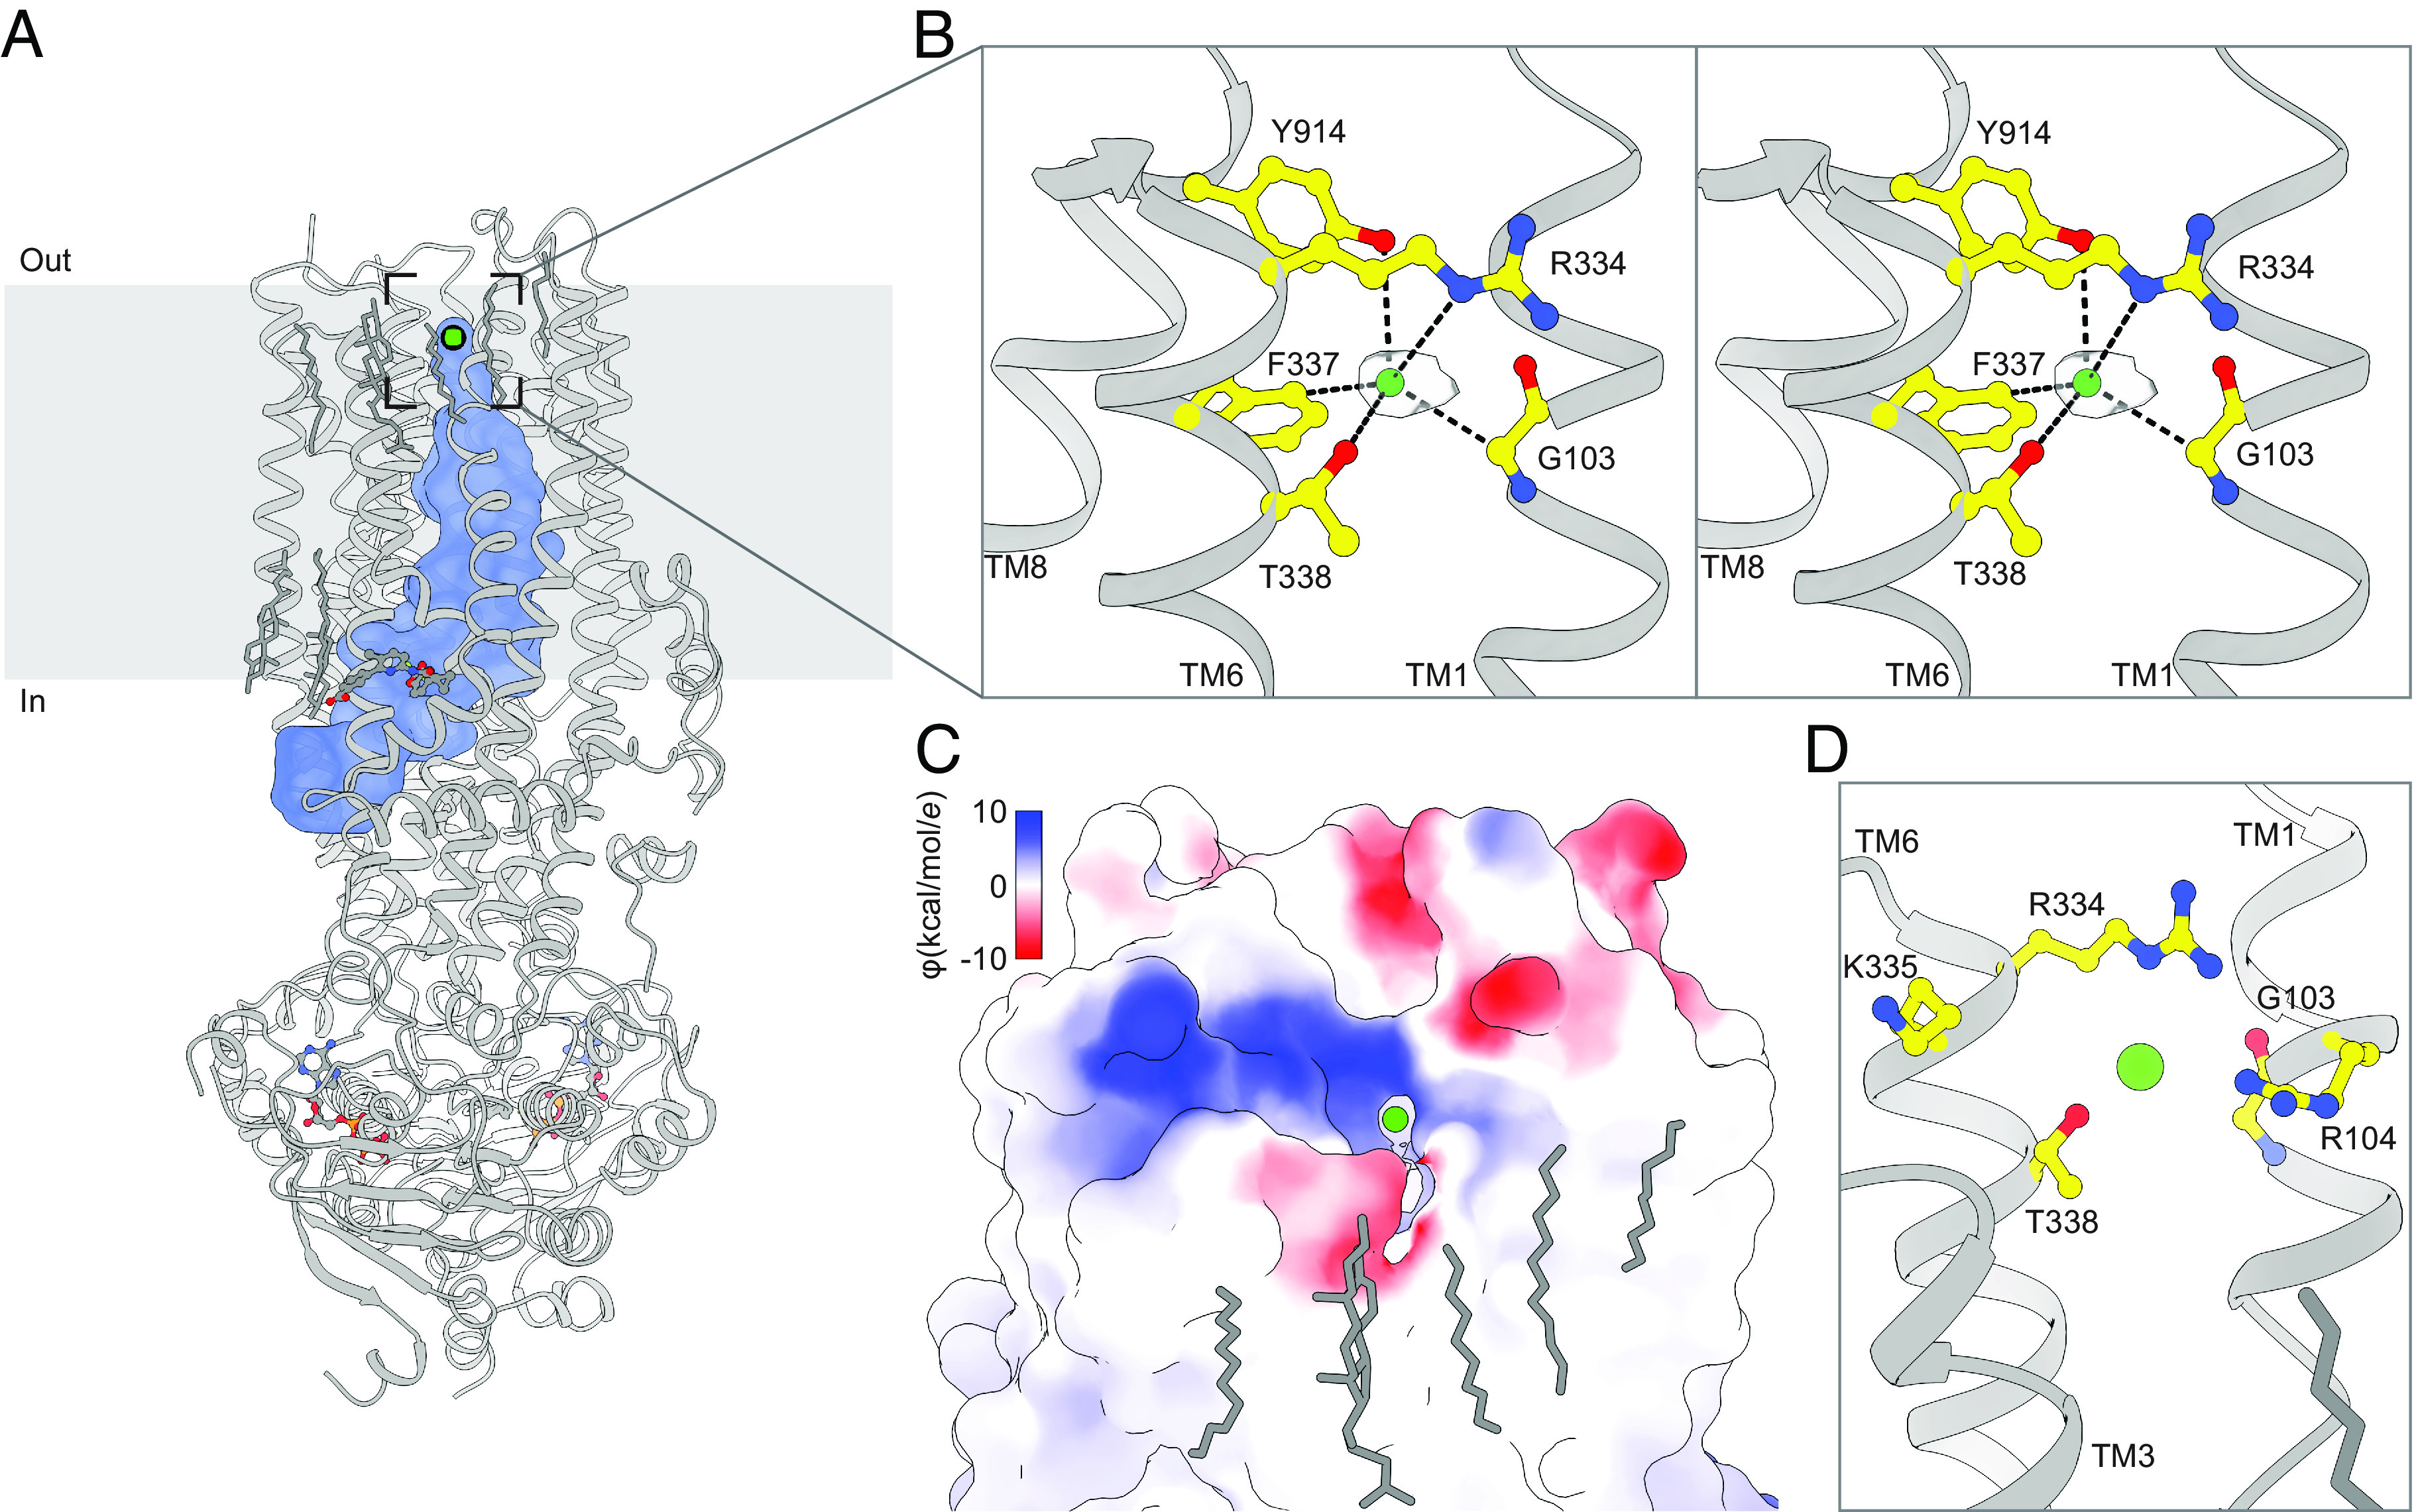
An anion selectivity filter in CFTR’s pore. (A) Structure of the ATP- and lumacaftor-bound E1371Q variant CFTR (Protein Data Bank 7SVD). The pore dimensions were mapped using a spherical probe with a radius equal to a dehydrated chloride ion (1.7 Å) and are shown as a blue surface. (B) Stereo view of chloride, shown as a green sphere within the experimental density, bound in the CFTR selectivity filter. (C) Surface representation of CFTR showing the extracellular exit from the selectivity filter. The surface is colored by electrostatic potential. (D) Closeup view from the same angle as in C of residues lining the extracellular exit from the selectivity filter.