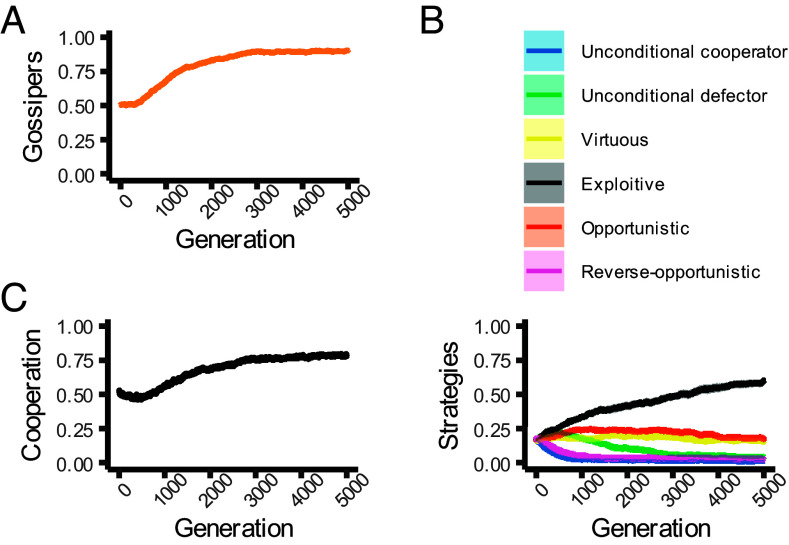
Fig. 3.
The evolutionary trajectories of different strategies and behaviors. The lines are average trajectories from 30 simulation runs with all the six cooperation strategies under the default parameter choice. The shadows show the SEs of the average trajectories. Plot (A) illustrates the evolution of gossipers. Plot (B) illustrates the evolution of different cooperation strategies. Plot (C) illustrates the evolution of cooperation.

