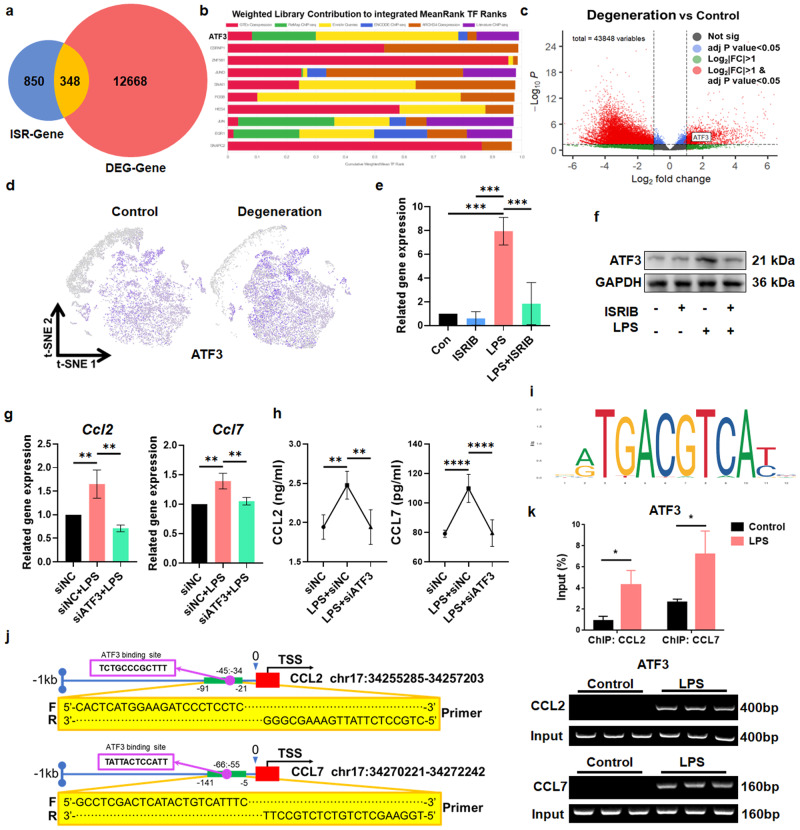
Fig. 5. ATF3 is the key regulator of CCL2/7 in IDD.
a Venn diagram showing overlapping genes based on ISR-genes and DEG-genes. b The CheA3 database was used to predict the transcription factors of the overlapping genes obtained in (A). c The volcano plot of DEG genes showed that the ATF3 gene was significantly upregulated in degenerative human NP tissue. d Relative expression of ATF3 in all cells projected onto a t-SNE plot based on the scRNA-seq data. e qPCR analysis of the expression of Atf3 in rNPCs treated with ISRIB for 1 h and LPS for 6 h. f Protein expression of ATF3 in rNPCs in the different groups. g qPCR analysis of Ccl2 and Ccl7 gene expression in LPS-treated rNPCs with ATF3 knockdown. h ELISA analysis of CCL2 and CCL7 levels in the supernatant of rNPCs. i The ATF3 binding motif was obtained from JASPAR. j Schematic illustration of the location of primers used for ChIP-qPCR. k ChIP analysis of control and LPS-treated rNPCs using ATF3 antibodies at the Ccl2 and Ccl7 promoters. Fold changes are expressed as the percentage of input. Experiments were performed at least 3 times, and the data are presented as the means ± SDs. *p < 0.05; **p < 0.01; ***p < 0.001; ****p < 0.0001; ns, not significant, with ANOVA.

