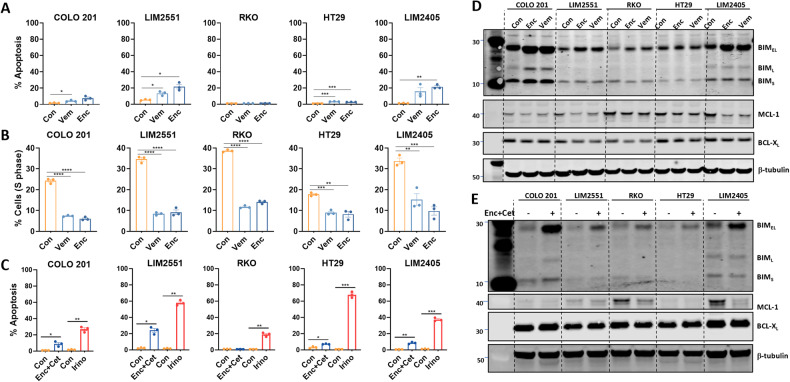
Fig. 1. BRAF inhibitors induce predominantly cytostatic effects in BRAFV600E CRC cell lines.
A, B BRAFV600E CRC cell lines were treated with vemurafenib (Vem, 5 μM) or encorafenib (Enc, 100 nM) for 72 h and stained with propidium iodide (PI) and analysed by FACS to determine (A) apoptosis induction (percentage of cells with sub-diploid DNA content), and (B) percentage of cells in S-phase. Values shown are mean ± SEM from a representative experiment performed in technical triplicate. Similar results were obtained in two additional independent experiments. Groups were compared using an unpaired Student’s t-test using Welch’s correction; *(p ≤ 0.05), **(p ≤ 0.01) and ***(p ≤ 0.001). C BRAFV600E CRC cell lines were treated with encorafenib (100 nM) plus cetuximab (10 μg/mL) (Enc+Cet) or irinotecan (10 μM)(Irino) for 72 h and apoptosis levels determined by PI staining as above. Values shown are mean ± SEM from a representative experiment performed in technical triplicate. Similar results were obtained in 2 additional independent experiments. Differences were compared using one-way ANOVA with Tukey’s multiple comparison testing; ns (not significant), *(p ≤ 0.05), **(p ≤ 0.01) and ****(p ≤ 0.0001). D, E Western blot analysis for BIMS/L/EL, MCL-1 and BCL-XL in BRAFV600E CRC cell lines treated with (D) encorafenib (100 nM) or vemurafenib (5 μM) or (E) encorafenib (100 nM) plus cetuximab (10 μg/mL) for 6 h. β-tubulin was used as a loading control.

