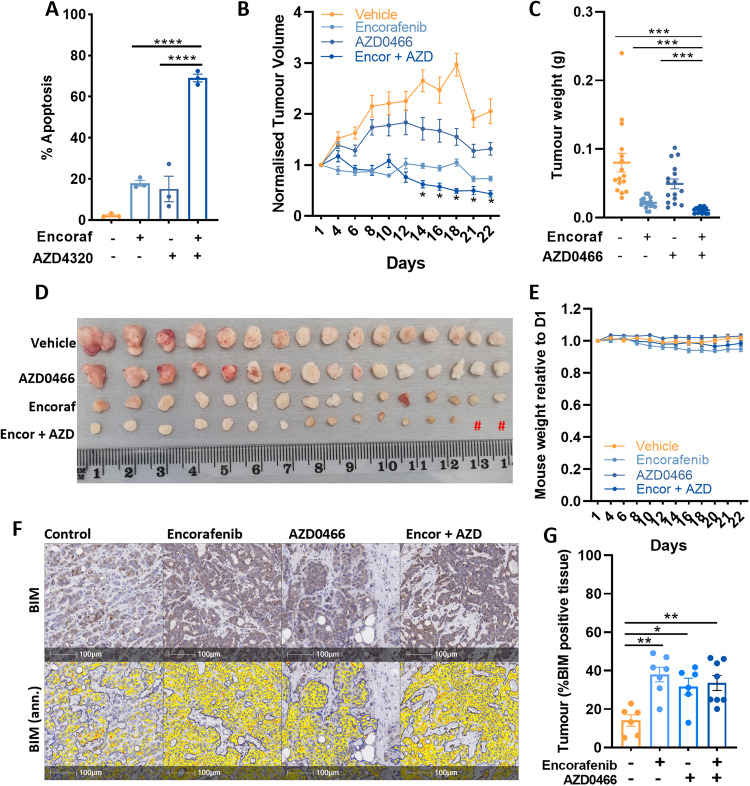
Fig. 6. Anti-tumour effects of encorafenib plus AZD4320/AZD0466 on BRAFV600E CRC cells in vitro and in vivo.
A COLO 201 cells were treated with encorafenib (100 nM) and AZD4320 (500 nM) alone and in combination for 72 h in vitro and apoptosis determined by PI staining and FACS analysis. Values shown are mean ± SEM from 3 independent experiments. Differences were compared using one-way ANOVA with Tukey’s multiple comparison testing; ****(p ≤ 0.0001). B Effect of encorafenib and AZD0466 on the growth of COLO 201 xenografts. NOD scid gamma mice (n = 8 per group) were subcutaneously injected with 2 × 10⁶ COLO 201 cells into the left and right flanks (n = 16 tumours per group except the combination treatment group where n = 14). Mice were then randomised to receive either vehicle control, encorafenib (20 mg/kg, b.i.d, og), AZD0466 (103 mg/kg, once weekly, I.V) or the combination, for 22 days. Tumour volume was determined by caliper measurements every second day and normalised to the volume at day 1 of treatment. Values shown are mean ± SEM. (C) Weight (g) and (D) representative images of excised tumours at experimental endpoint. Hash (#) depicts one less mouse (two less tumours) for the combination treatment group. E Relative change in mouse body weight from treatment commencement. Values shown are mean ± SEM. F Representative images of immunohistochemical staining of BIM in resected tumours and corresponding annotation performed using HALO software depicting areas of low (yellow), moderate (orange) and strong (red) BIM staining. G Quantification of BIM staining (percentage of positively stained tumour cells) in resected tumours. Values shown are mean ± SEM. Differences were compared using one-way ANOVA with Tukey’s multiple comparison testing; *(p≤0.05), **(p≤0.01), ***(p≤0.001) and ****(p≤0.0001).

