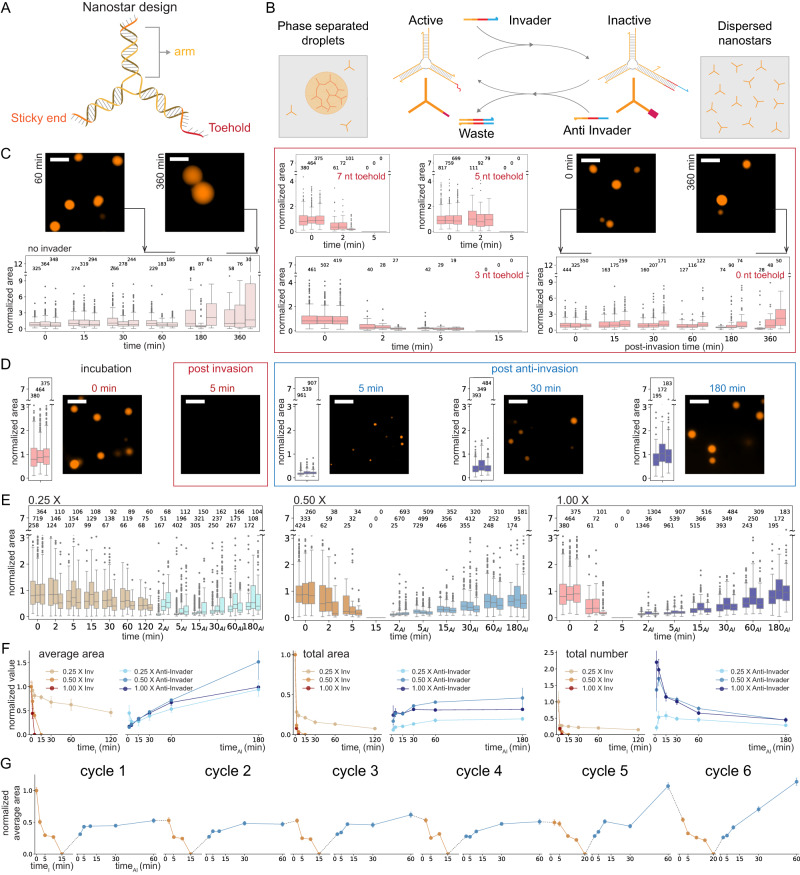
Fig. 2. Controlling condensation of DNA motifs over time via strand invasion and displacement reactions.
A Schematic of 3-arm DNA nanostar. One of the nanostar sticky ends was modified to include a single-stranded overhang or toehold (red domain on the 5′ end of one arm). B Schematic of the chemical reactions of invasion and anti-invasion for controlling the capacity of nanostars to yield phase-separated droplets. C Left: images and box plots illustrating droplet growth in the absence of invaders. Middle: box plots of droplet area after addition of invaders to nanostars with 7, 5, and 3 nt toeholds. Right: nanostars without a toehold do not dissolve after the addition of invaders. D Representative microscopy images of condensate droplets before the invasion, post-invasion (at 1×) and post-anti-invasion (at 1×), and box plots of condensate area. E Invasion and anti-invasion reactions for different concentrations of invader and anti-invader (from left to right: 0.25×, 0.5×, and 1×). For the anti-invasion experiments, the first measurement was taken 2 min after the addition of anti-invader to the corresponding invaded sample. F Normalized average area, normalized total area, and total number of condensates during invasion and anti-invasion reactions for different concentrations of invader and anti-invader. G Invasion and anti-invasion reactions can be sequentially repeated multiple times (bound invader and anti-invader form an inert complex whose concentration increases during this experiment). C–F Results of n = 3 experimental repeats. In box plots, the central line indicates the median, and the bottom and top edges of the box indicate the 25th and 75th percentiles. Whiskers extend to the most extreme data points not considered outliers. Dots indicate outliers. The number of measured condensates is indicated above the respective box. F Error bars represent the standard deviation of the mean over three experimental repeats. G Results of a single experiment; error bars derived from bootstrapping. Scale bars are 10 μm.

