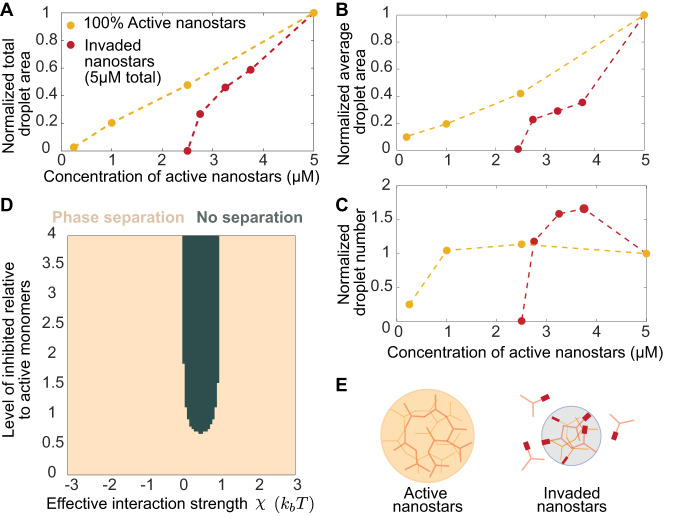
Fig. 3. Invasion allows for efficient control of phase separation.
A Normalized total condensate area was measured 30 min after annealing versus the level of active nanostars in the presence or absence of an invader. B Normalized average droplet area, and C Normalized average droplet number, measured 30 min after anneal. D Computational phase diagram (Supplementary Note 1) illustrating the existence of a range of interaction strengths between active and inactive monomers in which phase separation is suppressed at ~0.6 ratio of inactive/active monomers. E Schematic representation of the invasion process causing a reduction of the valency of individual nanostars. Invaded nanostars can still interact with other active nanostars, limiting their capacity to form condensates. Normalization is done relative to the area (average or total) measured at 5 µM nanostar. Each data point is drawn from a single experiment monitoring droplet growth kinetics (Supplementary Figs. 8–16).

