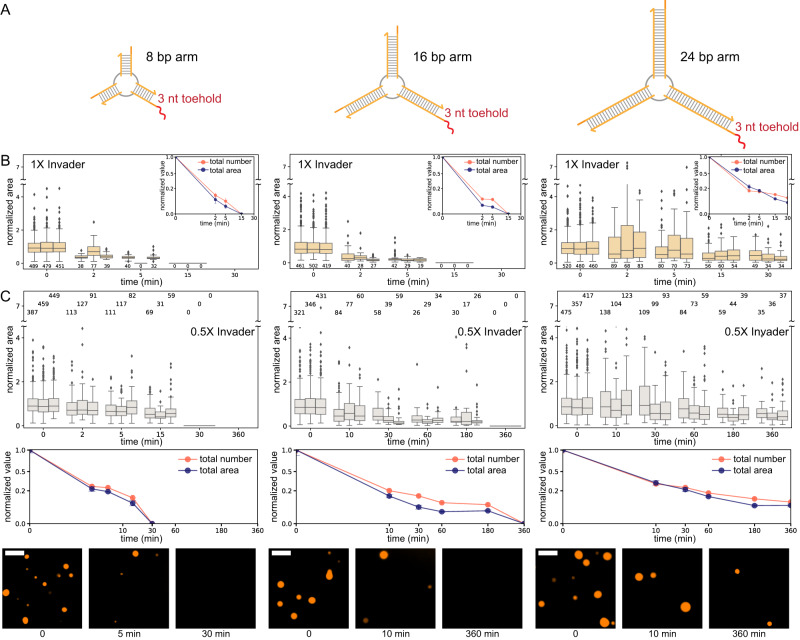
Fig. 4. Dissolution of droplets produced by nanostars of different sizes.
A Schematic representation of the nanostars with different arm lengths, the same sticky-end domain, and a 3nt toehold. B Addition of 1× invader, normalized droplet area (box plot), number, and total area (inset). C Addition of 0.5× invader, normalized droplet area (top row), number, and total area (middle row). The bottom row provides representative images of the samples at the beginning and 5 and 60 min after the addition of the invader. The bottom row provides representative images of the samples at the beginning and 5 and 60 min after the addition of the invader. Results of n = 3 experimental repeats. In box plots, the central line indicates the median, and the bottom and top edges of the box mark the interquartile range. Whiskers extend to the most extreme data points not considered outliers. Dots indicate outliers. The number of measured condensates is above or below each box. In the total number and area plots, dots indicate the mean over the three experimental repeats, and error bars indicate the standard deviation of the mean. Scale bars are 10 μm.

