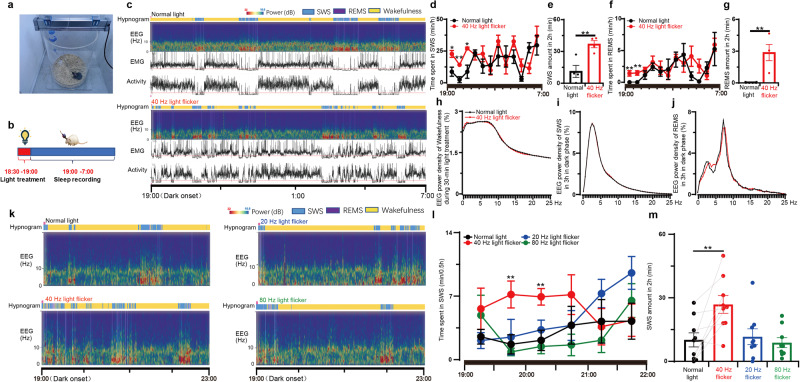
Fig. 5. Light flickering at 40 Hz induces sleep in a frequency-dependent manner.
a Paradigm of construction of light treatment and sleep recording system for mice. b Schedule for light treatments and sleep recordings. c The hypnogram, EEG spectrum, EMG, and locomotor activity in mice exposed to normal light and 40 Hz light flickering, respectively. d, f The time course of SWS and REMS in mice throughout the dark phase after exposure to normal light or 40 Hz light flickering treatment 30 min before the dark phase, respectively (n = 4/group); *P < 0.05; **P < 0.01, mean ± SEM, 40 Hz vs normal light, assessed by two-way ANOVA and Student’s t-test. e, g The amount of SWS and REMS during the initial 2 h after exposure of mice to normal light or 40 Hz light flickering 30 min before the dark phase (n = 4/group); *P < 0.05, 40 Hz vs normal light, assessed by Student’s t-test. h Superimposable power density of the wakefulness EEG spectra in mice during 30 min normal light or 40 Hz light flickering treatments (n = 4/group). i Superimposable power density of the SWS EEG spectra in mice after either normal light or 40 Hz light flickering treatments (n = 4/group). j Superimposable power density of the REMS EEG spectra in mice after either normal light or 40 Hz light flickering treatments (n = 4/group). k Representative hypnograms and EEG spectra of mice after treatments with light flickering at 20, 40, and 80 Hz, respectively. l The time course of SWS during 30 min blocks in the first 3 h after illumination at 20, 40, and 80 Hz frequencies. **P < 0.01 indicating significance at 20, 40, and 80 Hz compared to normal light using Student’s t-test (n = 9/group). m The amount of SWS during the following 2 h after exposure to normal light or 20, 40, and 80 Hz light flickering treatments 30 min before the dark phase (n = 9/group).

