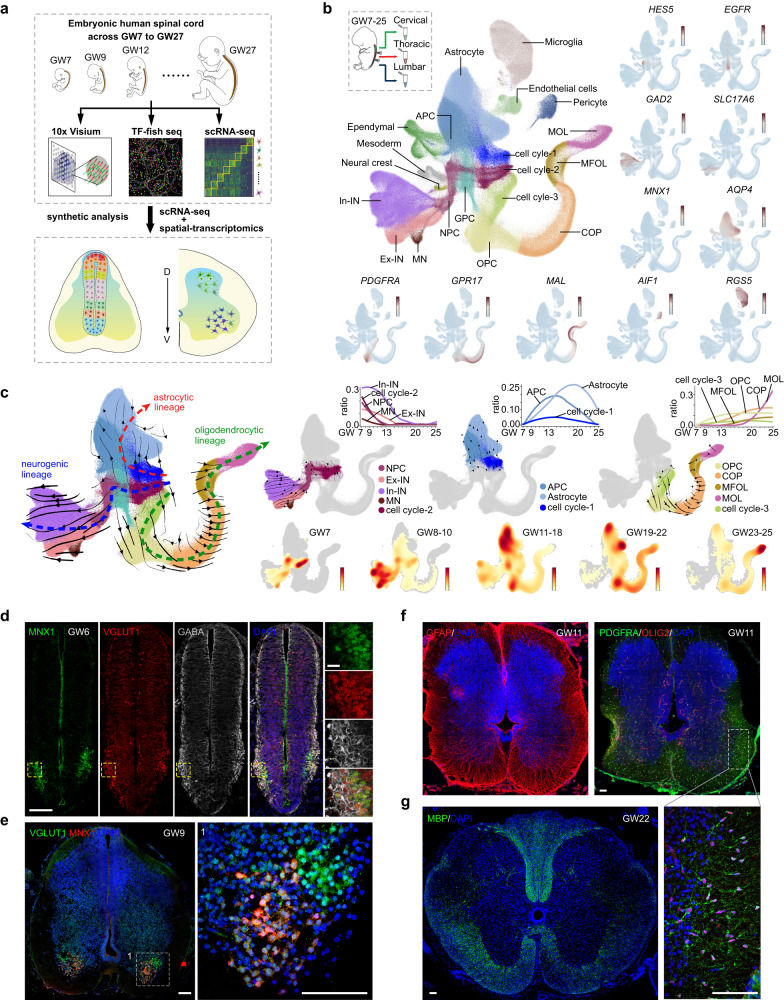
Fig. 1. A comprehensive spatiotemporal view of transcriptomic changes during human spinal cord development.
a A comprehensive spatiotemporally resolved transcriptomic landscape of the developing human spinal cord across GW7–27 was obtained through the use of scRNA-seq, TF-seqFISH, and 10× Visium technologies. This schematic provides an overview of the experimental design and analysis. b The developing human spinal cord from GW7–25 was segmented into cervical, thoracic, and lumbar regions and then analyzed using scRNA-seq. Through unsupervised clustering and marker gene expression, 20 distinct cell types were identified and annotated. The expression profiles of marker genes are depicted through a visualization where each dot represents an individual cell colored according to the expression level (dark red, high expression; light blue, low). c We present an analysis of the neurogenic, astrocytic, and oligodendrocytic lineages in the developing human spinal cord using RNA velocity (left). To aid interpretation, we have highlighted the three lineage trajectories separately (right). The changes in cell ratio over GWs are depicted by fitted curves, while a density map shows cell density at different gestational stages, with high density denoted by dark red. Unrelated cells were excluded from this UMAP analysis. d At GW6, the MNX1+ MNs, VGLUT1+ Ex-INs, and GABA+ In-INs could be easily identified in the ventral region of the spinal cord. The regions of interest are magnified in the boxes. Scale bars,100 μm (left) and 20 μm (right). e The spatial separation of MNX1+ MNs and VGLUT1+ Ex-INs in the human spinal cord at GW9 is demonstrated in this image. The areas within the boxes are shown in higher magnification to provide a better visualization. Scale bars, 100 μm (left), 20 μm (right). f The expression patterns of GFAP, OLIG2, and PDGFRA in the human spinal cord at GW11 are presented. The boxed regions are displayed at high magnification. Scale bar, 100 μm. g Expression of MBP in human spinal cord samples at GW22 is shown. Scale bars, 100 μm.

