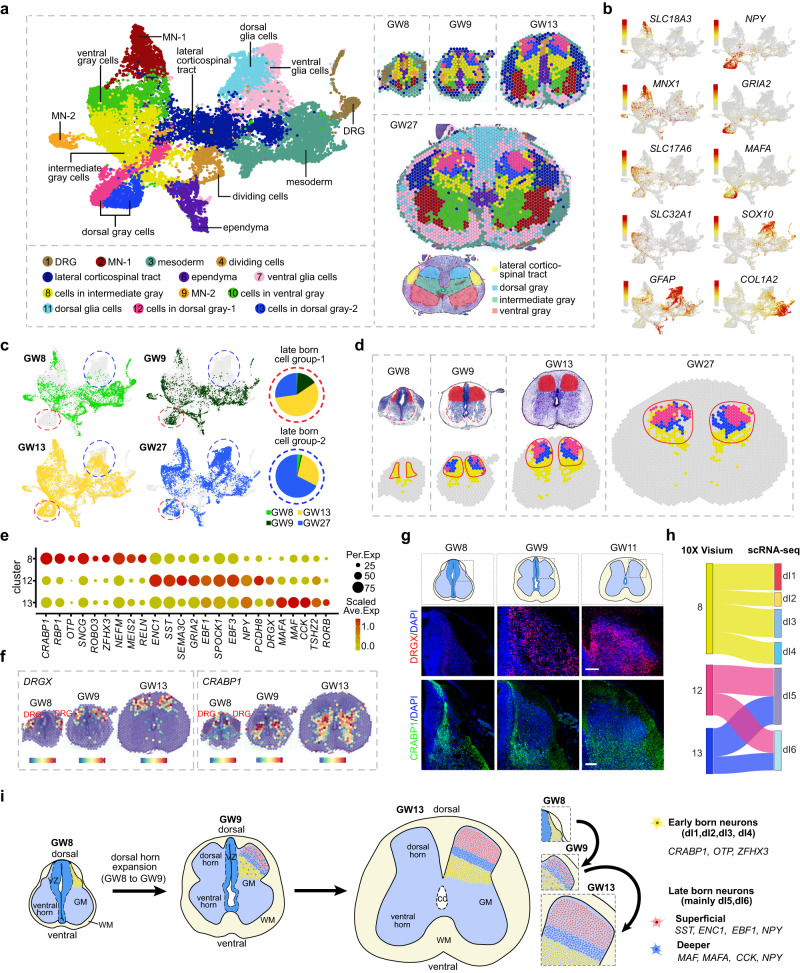
Fig. 4. Exploring the spatial, cellular, and molecular bases of dorsal horn development in the human spinal cord.
a A molecular-based classification of cells in the developing human spinal cord at various stages was performed using the dataset of 10× Visium. Unsupervised clustering was used to identify spots with a shared molecular profile, which were then annotated according to gene expression and spatial position (left). The spatial localization of these molecularly-defined cell groups was visualized in tissue slices at distinct timepoints (right). b The UMAP visualization displays the expression profiles of marker genes utilized to annotate spot clusters. Each dot represents an individual spot, colored based on the expression level (red, high; gray, low). c Distinct groups of spots derived from different embryonic stages were displayed separately. Notably, a group of spots primarily composed of Clusters 12 and 13, which were absent at GW8, were outlined with red circles. Furthermore, a group of spots mainly composed of Clusters 7 and 11, which were not detected at GW8 and GW9, were also identified and marked with blue circles. d The H&E staining images, with red insets highlighting the dorsal horns of the spinal cord at GW8 and GW9, reveal a marked expansion of the dorsal horn from GW8 to GW9. Notably, only spots in cluster 8 are detectable in the dorsal horn at GW8, whereas at GW9, spots from Clusters 12 and 13 emerge and are situated in a superficial layer of the dorsal horn. e A dotplot was generated to display the expression profiles of DEGs among Clusters 8, 12, and 13. The size of each dot in the plot is related to the detection rate, while the color bar is scaled with the average gene expression levels. f Spatially-resolved transcriptomic expression features of Cluster 8-specific CRABP1, as well as Clusters 12 and 13-specific DRGX at different developmental stages, are visualized on the 10× Visium platform. These features are overlaid with H&E staining to illustrate the anatomical structures. The DRG regions are outlined. g Immunostaining was performed on human spinal cord slices at GW8, 9, and 11 to examine the spatial expression features of DRGX and CRABP1. Scale bars, 100 μm. h The neuronal identities of Clusters 8, 12, and 13 have been determined through an integrated analysis of the datasets from 10× Visium and scRNA-seq, and are depicted in a Sankey diagram. i Schematic depiction of the cellular rules underlying the expansion and lamina formation of the dorsal horn during human spinal cord development.

