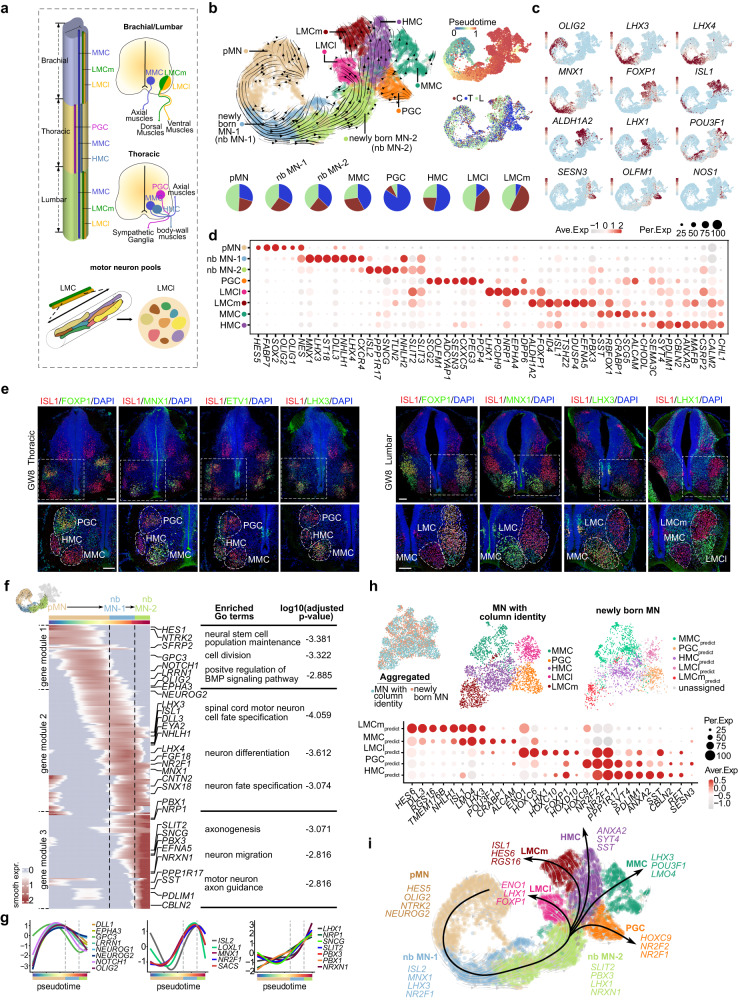
Fig. 5. The molecular programs account for the early specification of MN diversity.
a Schematic illustration to visually depict the organization of MN columns and pools across distinct spinal segments. b The ontogeny of MNs is deduced through RNA velocity analysis, which identifies the lineages of pMN, nascent MNs (newly born MN-1 and -2), and MNs with diverse columnar identities (LMCl, LMCm, HMC, PGC, and MMC) based on unique gene expression signatures, visualized through a UMAP plot. The analysis also presents pseudotime and segmental information, and the segmental cell composition of each MN subtype is represented by a pie chart. c The expression profiles of hallmark marker genes are depicted using a UMAP visualization. Each dot represents an individual cell and is color-coded according to its expression level (red, high; gray, low). d A dotplot visualizing the expression profiles of DEGs across various cell types of MNs is presented. e The identities of MNs in the developing human spinal cord have been accurately delineated at GW8, as evidenced by robust immunostaining in the thoracic and lumbar segments. Scale bars, 100 μm. f A developmental trajectory from pMN to newly born MN-2 has been identified using RNA velocity analysis, and a heatmap displaying the dynamic gene expression changes along pseudotime is presented. Furthermore, the corresponding enriched GO terms are also listed. g A depiction of the sequential waves of gene expression with similar patterns along the pseudotime axis is presented. h Upper: The aggregated dataset of newly born MNs and MNs with column identities is depicted using UMAPs, as well as the individual datasets of MNs with distinct column identities and newly born MNs with assigned column identities. Lower: The differential gene expression profile among newly born MNs with predicted fates is presented via a dotplot. i Schematic illustration of the genetic programs underlying MN differentiation and diversification.

