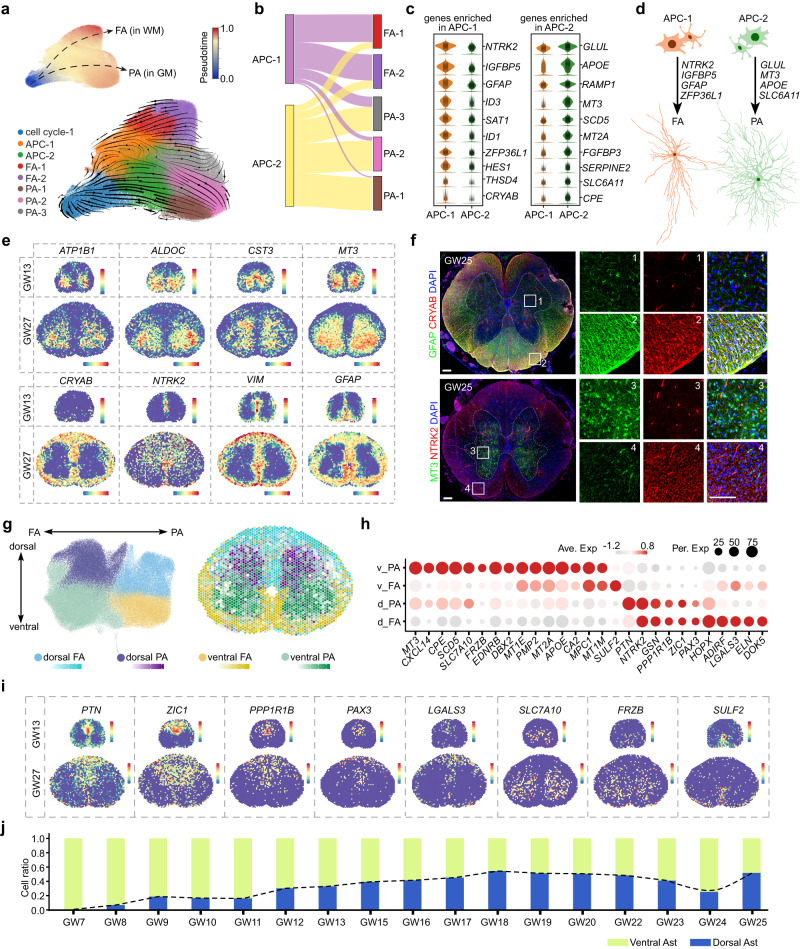
Fig. 6. The spatial heterogeneity of astrocytes in the developing human spinal cord.
a The developmental trajectory of astrocytes in the human spinal cord is analyzed using RNA velocity analysis, incorporating cell cycle-1, APCs, and astrocytes. Subtypes of APC (APC-1 and APC-2) and astrocytes (FA-1, FA-2, PA-1, PA-2, and PA-3) are identified based on characteristic gene expression, and the pseudotime of astrocyte cells is displayed in the upper right corner. b Pairwise integration determines the potential for differentiation into distinct astrocyte subtypes, as illustrated by a Sankey plot. c The specific gene enrichment in APC-1 and APC-2 cells is shown via violin plots. d Schematic depiction of the molecular programs that govern the differentiation of APC-1 into FA and APC-2 into PA. e The spatial distribution profiles for FA-specific and PA-specific genes are visualized through the 10× Genomics Visium platform. f The immunostaining results demonstrate the selective expressions of CRYAB and GFAP in the white matter, as well as the distinctive expression pattern of MT3 in the gray matter. Scale bars, 200 μm (left), 20 μm (right). g The heterogeneity of astrocytes is determined based on their positional allocation and fibrous or protoplasmic properties, and is demonstrated through UMAP embedding and spatially visualized using the 10× Visium datasets of GW27. h A dotplot depicting the distinct gene expression profiles of the four fundamental astrocyte groups is displayed. i The spatially resolved expression patterns of genes with dorsal and ventral preference are presented in a 10× Visium dataset. j A histogram is presented to show the ratios of ventral and dorsal astrocytes during various developmental stages. The dynamic of the cell ratios of dorsal astrocytes is indicated by the dotted line.

