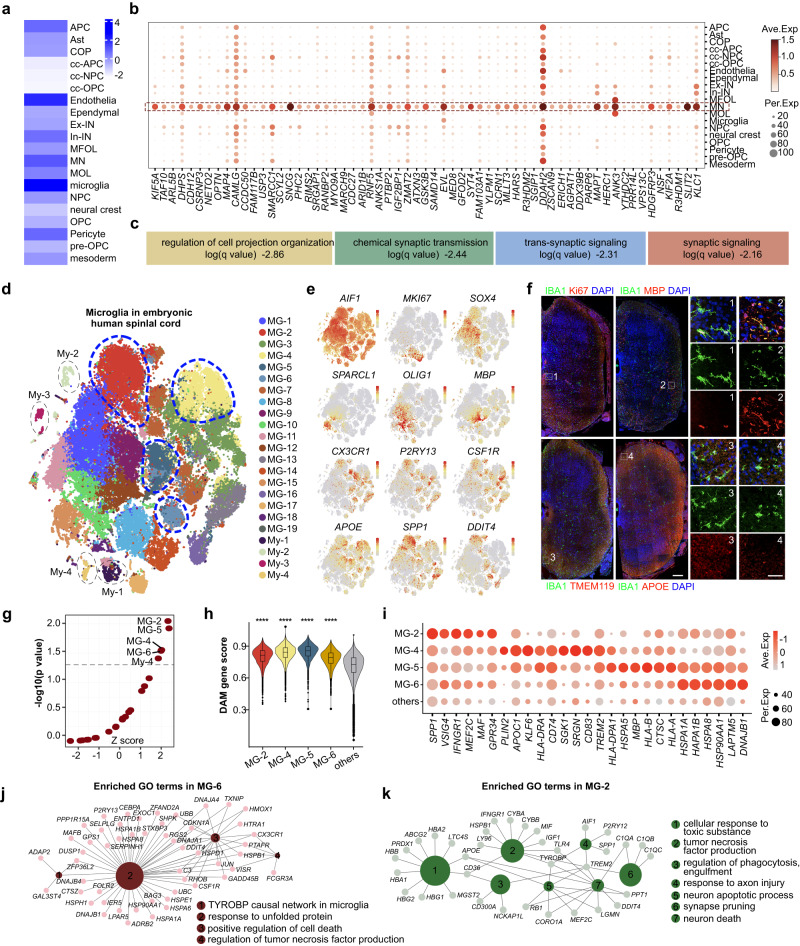
Fig. 7. Joint GWAS analysis reveals cell type-specific features of ALS pathogenesis.
a The susceptibility of different cell types in the human spinal cord to ALS was assessed through the calculation of Z scores using the scDRS method, which involved an integrated analysis of the scRNA-seq dataset of the developing human spinal cord and the ALS GWAS dataset. b The differential expression of MN-enriched risk genes associated with ALS, identified through GWAS, in different cell types is depicted in a dotplot. c Enriched GO terms attributed to risk genes enriched in MNs are presented. d The heterogeneity of microglia in the developing human spinal cord is visualized through t-distributed stochastic neighbor embedding (t-SNE). Each dot in the plot represents a single cell and is colored according to its cluster identity. e The gene expression profiles of heterogeneous microglia subclusters are displayed, with each dot representing an individual cell colored by the expression level (gray for low and red for high). f Heterogeneous microglial populations are discernible in the developing human spinal cord at GW16, as ascertained by immunostaining. Scale bars, 200 μm (lower left), 100 μm (right). g The relationship between diverse microglial subtypes and ALS risk loci identified through GWAS is established using scDRS analysis, with a significance threshold of P < 0.05 indicated by the dotted line. h Analysis of DAM gene scores reveals transcriptomic similarity between distinct microglia types and DAMs. Notably, MG-2, MG-4, MG-5, and MG-6 exhibit significantly higher scores compared to other microglia subtypes. i Dot plot depicting the characteristic gene expression profiles of microglia subtypes MG-2, MG-4, MG-5, and MG-6. j, k The GO terms and genetic networks enriched in microglia subtypes MG-2 and MG-6 have been analyzed based on their top 50 DEGs.

