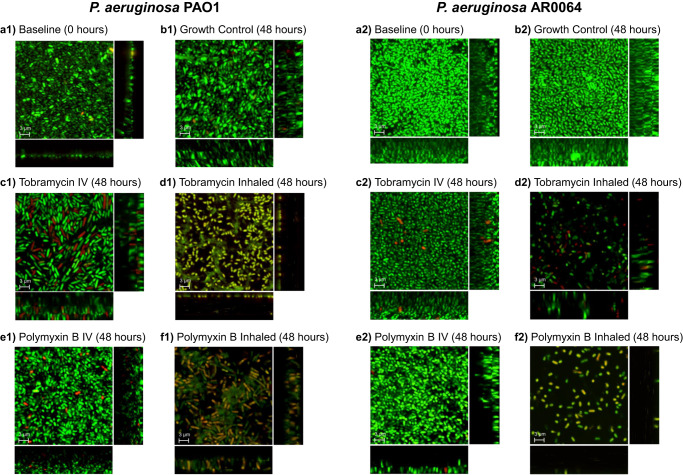
Fig. 4. Confocal laser scanning microscopy with LIVE/DEAD stain of biofilm-embedded cells of P. aeruginosa before and after exposure to antibiotics.
P. aeruginosa isolates (A1-F1) PAO1 and (A2-F2) AR0064 were imaged following exposure to polymyxin B and tobramycin. Representative images are shown at a 0 h, b 48 h of no treatment, c 48 h of simulated tobramycin intravenous treatment, d 48 h of simulated polymyxin B intravenous treatment, e 48 h of simulated tobramycin inhaled treatment, f 48 h of simulated polymyxin B inhaled treatment. Green indicates live cells stained by Syto 9, red or yellow cells indicate dead cells stained by propidium iodide. The central image is a compilation of all planes and the rectangle images on the right and below indicate XZ and YZ planes respectively to indicate the thickness of the biofilm. The average thickness of the imaged biofilm Z-stacks was 9.4 μm. Scale bars are 3 µm.

