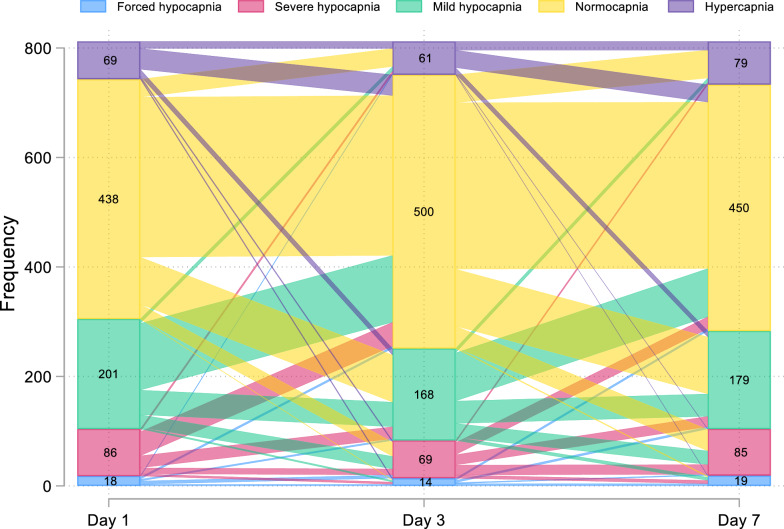
Fig. 2.
Sankey plot providing a visual representation of the transition of patients with different categories of abnormal PaCO2 at day 1, 3, and 7. The different colors show the number of patients in each PaCO2 category and how they changed from day 1 to day 7. Most of the transitions occurring in the hypocapnia group were toward normocapnia. Most patients with forced hypocapnia remained in the same category, whereas most patients with hypercapnia evolved toward normocapnia. Overall, the pattern of flows between days 3 and 7 was similar to the pattern of flows between days 1 and 3

