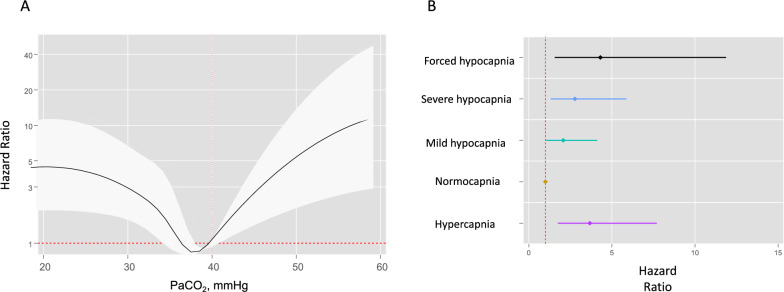
Fig. 3.
A Association between PaCO2 (modeled as a continuous variable) and in-hospital mortality using a longitudinal survival regression. PaCO2c was modeled with 5-df restricted cubic splines (RCS). For esthetic purposes, PaCO2 distribution was trimmed between 20 mmHg and 60 mmHg. The graph shows the adjusted hazard ratio (aHR) for in-hospital mortality on the y-axis across the full range of PaCO2 values on the x-axis. The solid line represents the hazard ratio and the shaded area is the 95% confidence interval. B The association between categorical PaCO2 values and in-hospital mortality risk using a longitudinal survival regression. The graph shows the hazard ratios with 95% confidence intervals using normocapnia a reference category

