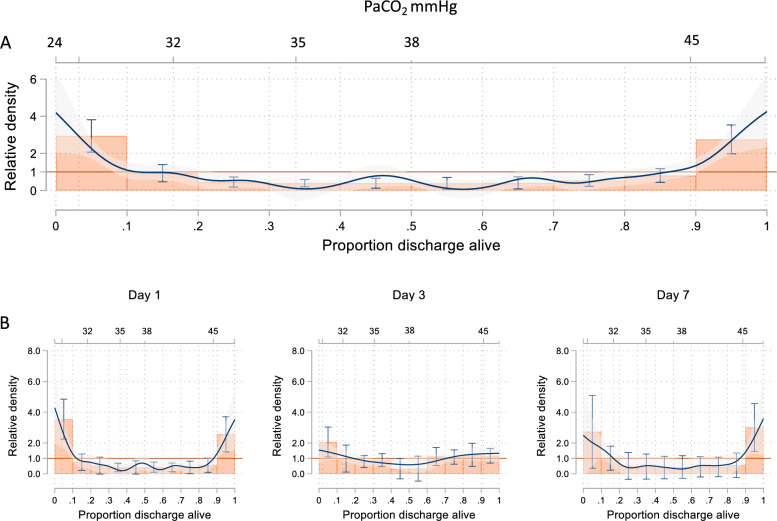
Fig. 4.
a and b Relative distribution analysis aimed at exploring the relationship between the entire distribution of partial pressure of carbon dioxide, PaCO2c with in-hospital mortality. The horizontal axis shows the cumulative proportion of the reference group (PaCO2c values when in-hospital mortality = 0). The vertical axis shows the relative density, which is the ratio of densities between the two distributions at each percentile of the reference group. The 95% confidence intervals indicate whether the relative density at each percentile is significantly different from 1

