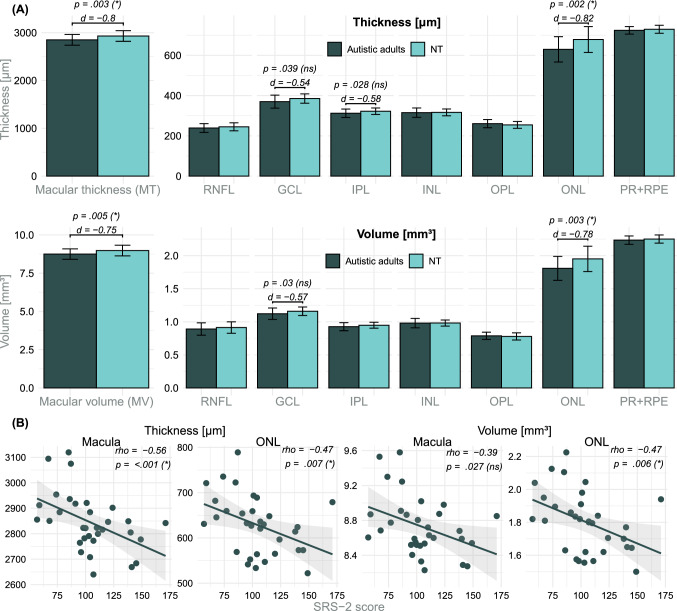
Fig. 2.
A Analysis of the total ETDRS grid data. Average (arithmetic mean and standard deviations as error bars) of the macular and intraretinal layer thicknesses in µm and volumes in mm3 for autistic adults and NT. P values < .05 of the group coefficients from the robust regression models and their effect sizes (Cohen’s d) are depicted. B Macular and ONL thickness and volume in relation to the total SRS-2 scores of autistic adults. Spearman’s rho and corresponding p values with Benjamini-Hochberg (Benjamini & Hochberg, 1995) adjusted significance levels in parentheses (*/ns) are shown. d Cohen’s d; GCL ganglion cell layer; NT neurotypical adults; INL inner nuclear layer; IPL inner plexiform layer; ns not significant; ONL outer nuclear layer; OPL outer plexiform layer; RNFL retinal nerve fiber layer; PR + RPE photoreceptor-retinal pigment epithelium complex; SRS-2 Social Responsiveness Scale 2; * significant

