Fig. 3.
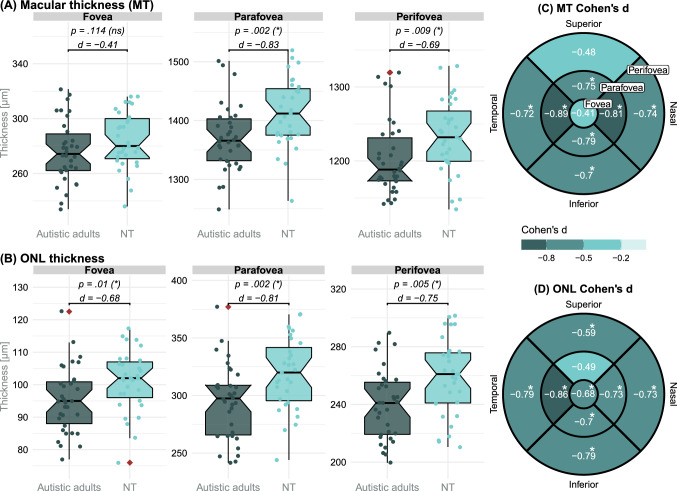
Region and sector analysis of the macular and ONL thickness. The three foveal regions of the MT (A) and ONL thickness (B) were analyzed in a first step. P values for group coefficients (βgroup) from the regression models and corresponding effect sizes (Cohen’s d) are depicted. Outliers are indicated by red diamond dots. Benjamini-Hochberg (Benjamini & Hochberg, 1995) adjusted significance level in parentheses (*/ns). Subsequently the MT (C) and ONL thickness (D) data were analyzed on ETDRS (Chew, 1996) sector level to localize group differences more precisely. Cohen’s d for group differences is depicted for the 9 ETDRS (Chew, 1996) sector tiles. The number of tests per analysis (region/sector level) was considered for the correction. d Cohen’s d; MT macular thickness; ns not significant; NT neurotypical adults; ONL outer nuclear layer; * significant

