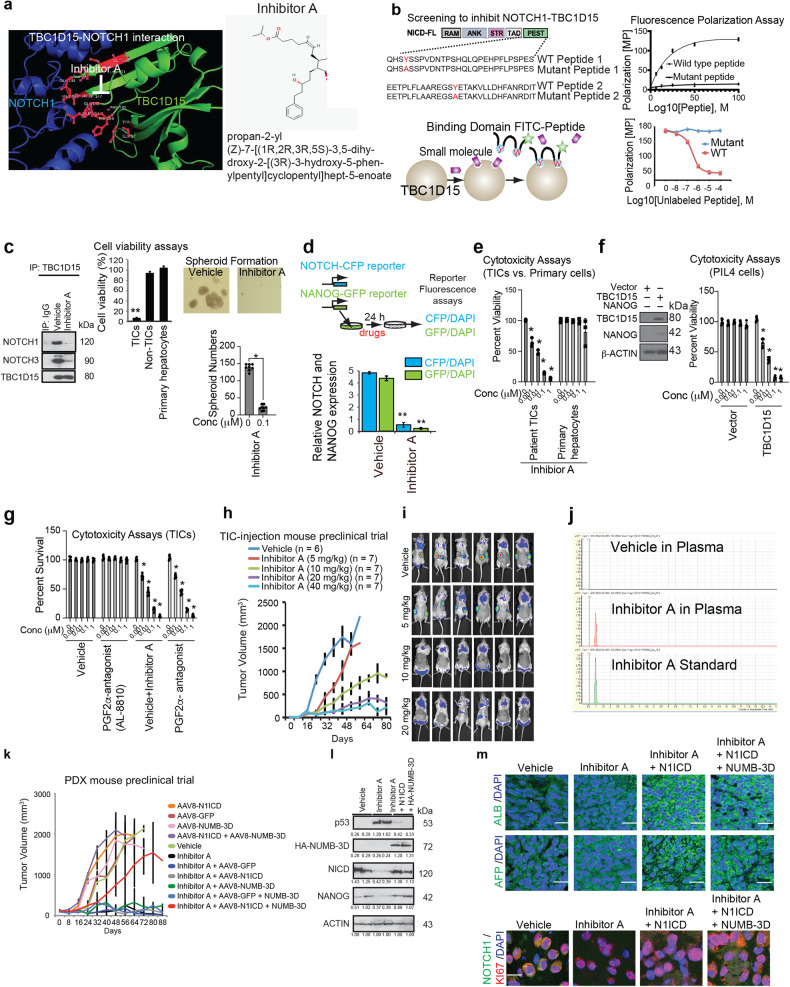
Fig. 6. A small molecule inhibitor of the NOTCH1-TBC1D15 interaction inhibited PDX tumor growth.
a (Left) Analysis of the 3D structure of the TBC1D15-NOTCH1 interaction identified the docking of the TBC1D15 N-terminal region (green) with aa1805-2113 of NOTCH1 (blue). Inhibitor A efficiently binds the interaction domains for both the TBC1D15-NOTCH and TBC1D15-NUMB interactions. (Right) Structure of Inhibitor A. b A diagram depicting the screening scheme for selective inhibitors of the TBC1D15-NOTCH interaction using the wild-type NOTCH1 PEST domain peptide and its mutant. Both were labeled with FITC and used with recombinant TBC1D15 for a fluorescence polarization assay. The mutant served as a negative control. A diagram depicting the results of the fluorescence polarization assay (FPA) with the wild-type (WT) and mutant NOTCH1 PEST domain peptides and TBC1D15. FPA signal induced by the FITC-labeled wild-type and mutant PEST domain peptides with TBC1D15 as a function of the peptide concentration (Right top); competitive inhibition of the signal with the unlabeled WT peptide and the mutant peptide (Right bottom). c NOTCH1-TBC1D15 inhibitor characterization. Inhibitor A blocked the NOTCH1/3-TBC1D15 interactions (Left) and selectively killed CD133(+) Huh7 cells without killing CD133(−) Huh7 cells or primary hepatocytes. Inhibitor A effectively abrogates the interaction of TBC1D15 with NICD1, as shown by IP-IB. Effects of Inhibitor A on the NICD1-TBC1D15 interaction: (Left) Inhibitor A blocked the interaction between TBC1D15 and NICD1. (Right) Inhibitor A inhibited TIC self-renewal and tumorigenicity. Inhibitor A suppressed TIC self-renewal, as determined by a spheroid formation assay. d Inhibitor A treatment abrogated NOTCH-CFP and NANOG-GFP reporter activity (bottom). **p < 0.01. e Inhibitor A reduced the viability of patient-derived primary TICs but not that of primary human hepatocytes. f Mouse hepatoblast PIL-4 cells become sensitized to Inhibitor A, which exhibited cytotoxic effects against acquired self-renewal activity induced by TBC1D15 expression. g The FP antagonist failed to rescue Inhibitor A-induced cytotoxicity in TICs. (Left) The growth of TIC-derived tumors was dose-dependently reduced by Inhibitor A in NSG mice. *p < 0.05 vs. vehicle. h Dose-dependent inhibitory effect of Inhibitor A on tumor growth in NSG mice transplanted with dsRed-labeled TICs. i Scanning fluorescence imaging of tumors generated from TICs transduced with lentivirus-dsRed on Day 40 post injection, revealing the marked tumor-suppressive effect of the 20 mg/kg dose. Imaging of dsRed-labeled tumors in the mice described above. Red, yellow, and green fluorescence was detected in mice treated with vehicle or the 10 mg/kg but not in those treated with higher doses. j Mass spectrometry analysis of plasma collected 6 h after the last Inhibitor A administration. Inhibitor A was detected in the treated mice but not in the vehicle-treated mice. k Inhibitor A suppressed the growth of patient-derived HCC cells transplanted into NSG mice (PDX model), and this effect was abolished by N1ICD and NUMB-3D transduction. The tumor-killing effects of Inhibitor A are mediated by the activated NICD, the phosphomimetic NUMB and the restoration of p53 protein expression. l Inhibitor A-treated xenograft tumors had an elevated p53 protein level but reduced N1ICD and NANOG protein levels. m Representative images of immunohistochemical staining for liver cancer markers [albumin (ALB), α-fetoprotein (AFP)], NOTCH1, and KI67 in human normal liver tissues vs. hepatocellular carcinoma tissues. Scale bars = 11.53 µm. The insets show the 10X images at 100X magnification.

