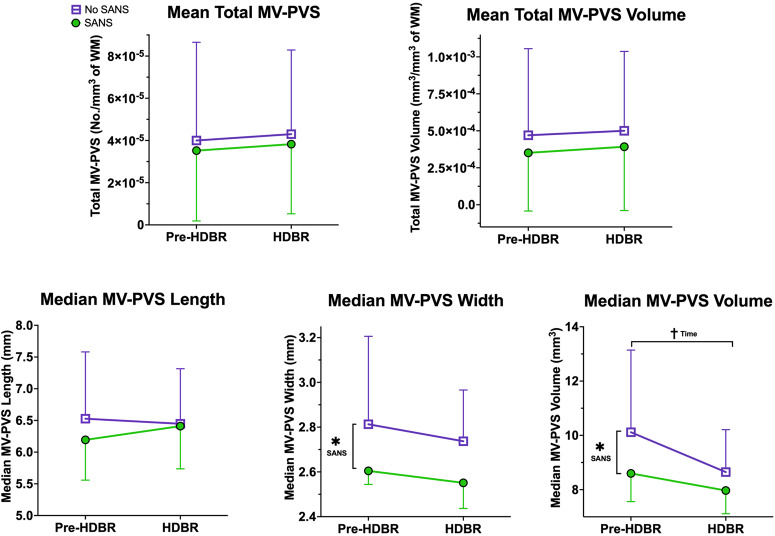
Fig. 3. Changes in MV-PVS metrics with bed rest in SANS versus No-SANS.
Here in each plot, we depict the group average MV-PVS characteristics for the total sample (HDBR (controls) and HDBR + CO2), with error bars representing the standard deviation. The data are split into SANS (green) and No-SANS (purple) subgroups. *Indicates a statistically significant (p < 0.05) group difference between the SANS and No-SANS participants for changes in median MV-PVS width and volume with bed rest. †Indicates a statistical trending (p < 0.10) time effect for median MV-PVS volume from pre- to post-bed rest. SANS spaceflight-associated neuro-ocular syndrome, MV-PVS magnetic resonance imaging-visible perivascular space, WM white matter.

