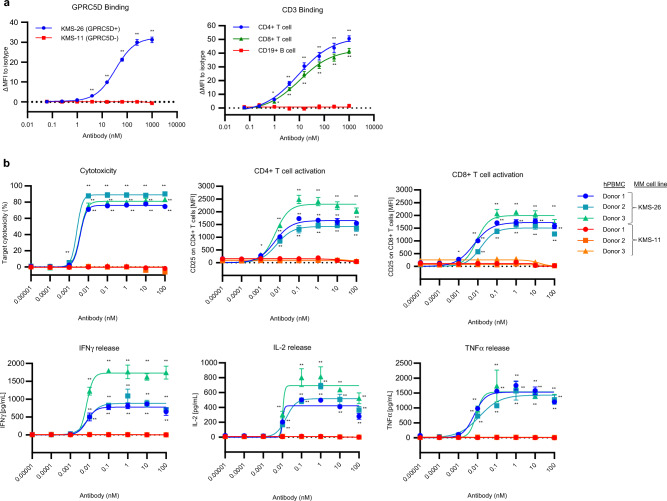
Figure 1.
Binding profile and in vitro efficacy of BsAb5003. (a) The binding profile of BsAb5003 on target cells was analyzed using flow cytometry. The binding activity of various concentrations of BsAb5003 on MM cell lines, KMS-11 and KMS-26 (left), or CD4 + T, CD8 + T, and CD19 + B cells among hPBMCs (right) were plotted as change of median fluorescence intensity (ΔMFI). ΔMFI was calculated by subtracting MFI of isotype antibody-treated sample from MFI of BsAb5003-treated sample. Statistical significance (compared to 0.061 pM group) was determined using a one-tailed Williams test (*P < 0.025, **P < 0.005). (b) GPRC5D-positive KMS-26 cells and GPRC5D-negative KMS-11 cells were cocultured with hPBMCs from three healthy volunteers with serial dilution of BsAb5003. Culture supernatants were collected and IFNγ, IL-2, and TNFα were measured using a Luminex system on day 1(bottom three figures). Cytotoxicity, CD4 + T cell activation and CD8 + T cell activation were measured by flow cytometry on day 3(top three figures). The assay was conducted in triplicate and the data represent the mean ± standard error. Statistical significance of BsAb5003 treatment was determined using a one-tailed Williams test (*P < 0.025, **P < 0.005).

