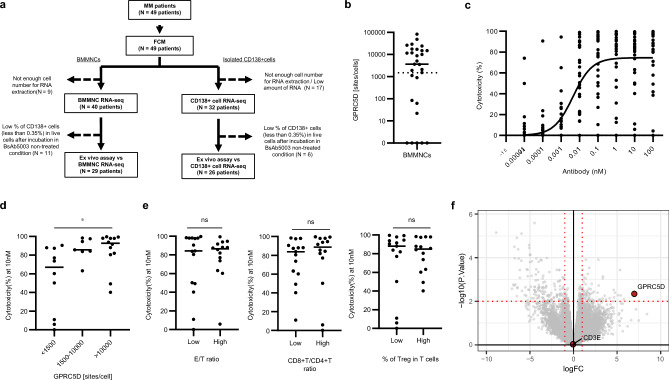
Figure 3.
Ex vivo efficacy of BsAb5003 against patient-derived BMMNCs. (a) Flow of MM patient sample studies. Cytotoxicity of BMMNCs was analyzed for samples containing more than 0.35% live CD138 + cells after incubation under BsAb5003-untreated conditions (29 patients). RNA-seq data of BMMNCs from the corresponding 29 patients were used for analysis. RNA-seq data of CD138 + cells isolated from BMMNCs were also obtained, and those of 26 patients were used for analysis. (b) Surface GPRC5D expression level on CD138 + MM cells evaluated by flow cytometry using QIFIKIT was plotted. (c) MM patient-derived BMMNCs were incubated for 2−4 days with serial dilution of BsAb5003. Individual values of MM cell cytotoxicity of all 29 MM patients’ samples in each assay were plotted. A non-linear sigmoid curve for all samples (n = 29) is also indicated in the plot. (d) Cytotoxicity induced by 10 nM BsAb5003 treatment was compared among three groups with different GPRC5D expression (< 1500 sites/cell, 1500−10 000 sites/cell, and > 10 000 sites/cell). Statistical significance among the three groups was determined using a Steel–Dwass test (*P < 0.05). (e) Median E/T ratio, CD8 + T/CD4 + T ratio and Treg proportion among T cells were each used to divide the subjects into two groups, which were then compared in terms of the cytotoxicity induced by 10 nM BsAb5003 treatment. Statistical significance was determined by a two tailed Wilcoxon test (ns: P > 0.05). (f) Linear regression showing genes whose expression changed in relation to drug effect. The x-axis shows the change in gene expression for a one-unit change in MM cell cytotoxicity as a fold change. The y-axis shows the log10 of the p value as the significance of the change of gene expression. The vertical and the horizontal red dotted lines indicate a twofold change and a p value of 0.01, respectively.

