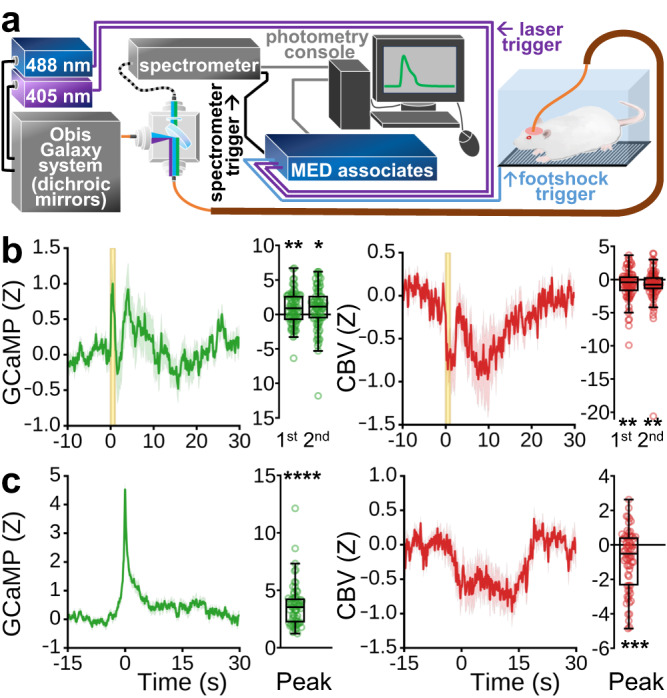
Fig. 3. Simultaneous calcium activity and CBV measurements in awake, freely moving rats using spectral fiber-photometry.

a Fiber-photometry instrumental setup. b Neuronal (left) and vascular (right) activity time-locked to pseudorandomly presented 1 s footshocks (n = 9 rats, 79 footshocks total). Two prominent GCaMP and CBV peaks were visually identified and the response amplitude for each was quantified to the right of their respective time-courses (one-sample two-tailed t-tests: GCaMP 1st peak, GCAMP 2nd peak, CBV 1st peak, CBV 2nd peak; *p < 0.05, **p < 0.01). c Average of strong spontaneous GCaMP peaks exceeding 97.7th percentile amplitude, and at least 30 s from neighboring peaks, from animals at rest (left), and (right) average vascular response from the same time-windows (n = 9 rats, 66 peaks), with respective peak amplitude quantification (one-sample two-tailed t-tests: GCAMP peak, CBV peak; ***p < 0.001, ****p < 0.0001). The footshock and spontaneous peak activation data, after correcting for sensor cross-talk51,93, generally exhibit opposing response polarities in GCaMP (mostly above zero) and CBV (mostly below zero) signals, suggesting atypical neurovascular coupling. Nevertheless, there are also notable non-opposing features between footshock GCaMP and CBV responses (e.g., t = ~5 s and ~15–30 s). This observation underscores the intricate coupling relationship between neuronal and vascular activities in more naturalistic conditions. Additionally, while motion confounds may be present in our footshock data, motion typically induces same directional changes in both the green and red spectra216, so the generally opposing polarity of GCaMP and CBV signals observed here, particularly at stimulation onset, argues against motion as a major contributing factor in these signals. Time-course data are presented as mean ± SEM. Box plots span IQR, with median line and whiskers within bounds ±1.5 IQR, using Tukey’s method. Exact p-values and test statistics are in Source Data. Source data are provided as a Source Data file.
