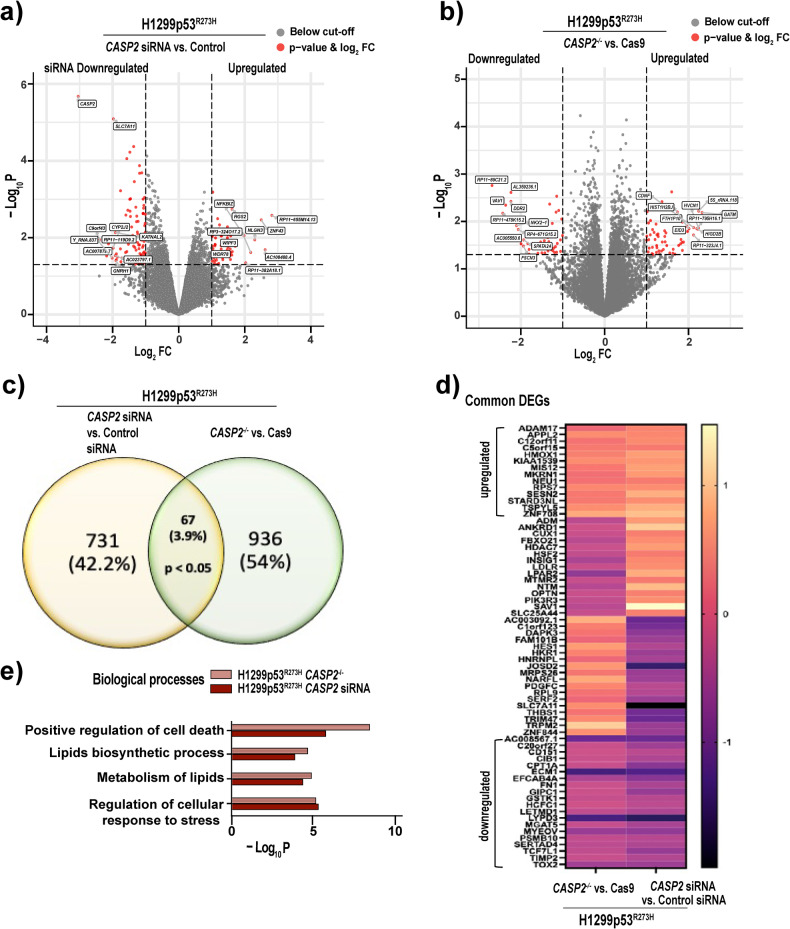
Fig. 3. Loss of caspase-2 alters the expression of genes involved in the regulation of cellular stress pathways.
Volcano plots illustrating DEGs in a H1299p53R273H cells transfected with CASP2 siRNA vs. control siRNA and b CASP2−/− vs. Cas9 H1299p53R273H cells. Red dots indicate DEGs with nominal P-value < 0.05 and log2FC > or < –1. The top 10 (based on log2FC) upregulated and downregulated DEGs are labeled. c Venn diagram of unique and overlapping DEGs (P-value < 0.05) in CASP2 siRNA vs. control siRNA group and CASP2−/− vs. Cas9 group. d Heat-map displaying common up/downregulated genes with log2FC > 1 or < -1. e GO term analysis of the significantly enriched biological processes (nominal P-value < 0.01) in common DEGs in the absence of caspase-2 using Metascape [8].

