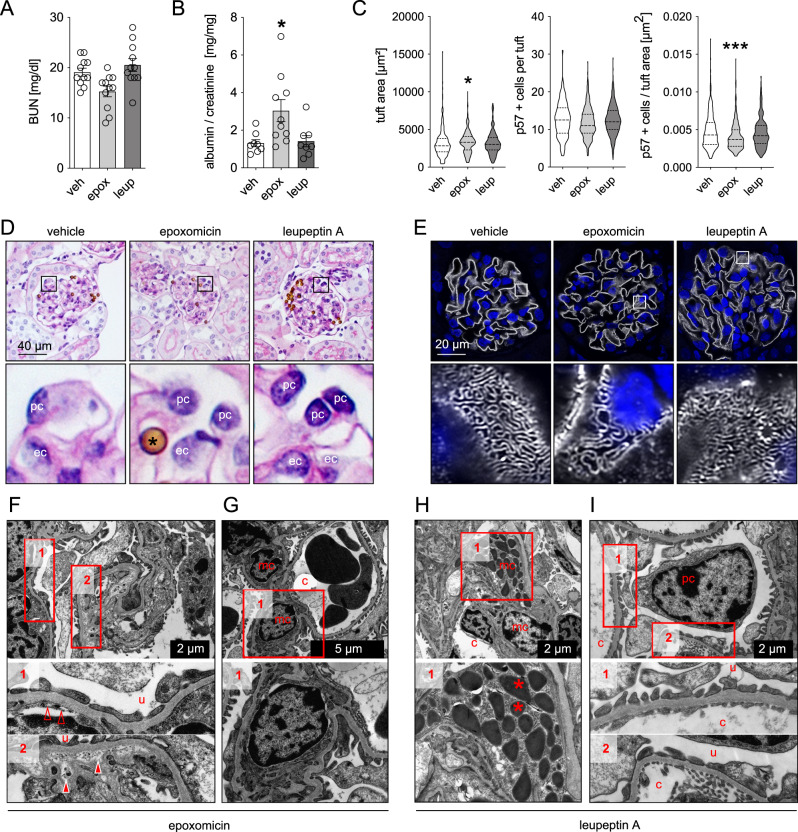
Fig. 4. Proteasome inhibition results in morphological and functional alterations of the glomerular filtration barrier.
Mice were treated with the irreversible proteasome inhibitor epoxomicin (0.5 µg/g bodyweight), the lysosomal inhibitor leupeptin A (40 µg/g bodyweight) or equal volumes of DMSO (vehicle, 125 µl) on four consecutive days. Urine, serum, and kidneys were collected and analyzed. Micrographs were analyzed from 3 individual experiments, with 3 micrographs per group. A Blood-urea nitrogen (BUN) measurement to assess renal function, n = 11 per group. B Albuminuria measured by ELISA to urinary albumin and normalized to corresponding creatinine to assess for glomerular filtration barrier functionality, n = 8 (veh, leup), n = 10 (epox). C Glomerular tuft area and absolute or relative podocyte number were quantified by immunohistochemical staining for the podocyte marker p57 in kidney paraffin sections (n ≥ 16 per group). All shown statistical analyses: one-way ANOVA with Dunn’s multiple comparison test, mean ± SEM, *p < 0.05, ***p < 0.001, n ≥ 11 per group, pooled data from 3 independent experiments. D Glomerular morphology assessed by PAS staining, *magnetic bead originating from glomerular isolation procedure, pc podocyte, ec glomerular endothelial cell. E High-resolution confocal micrograph of immunofluorescent staining for the slit diaphragm protein nephrin (white) and DNA (blue, Hoechst) to assess for podocyte foot process effacement. F–I Electron microscopical ultrastructural analyses exhibit focal podocyte foot process effacement and loss of endothelial fenestrations (empty arrow heads) as well as focal splitting of the glomerular basement membrane with accumulation of electron dense material (filled arrow heads) in epoxomicin-treated mice. c capillary lumen, u urinary space. F, G In leupeptin A treated mice (H, I) mesangial cells (mc) show electron dense lysosomal storage (asterisks). Source data are provided as a Source Data file.

