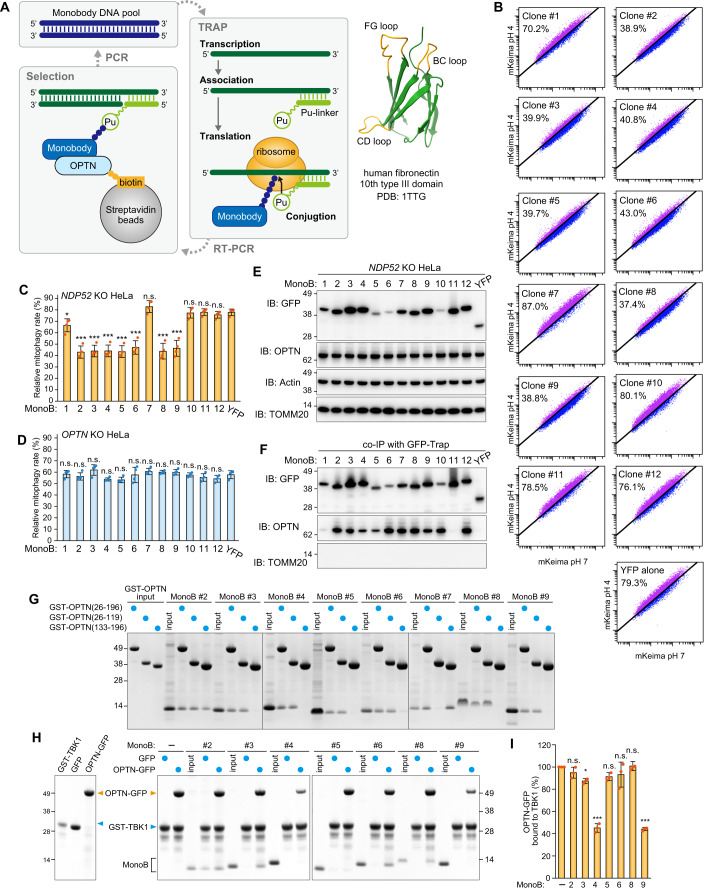
Figure 6. Selection and validation of OPTN monobodies.
(A) Schematic representation of the process to select monobodies against OPTN using TRAP display. The BC, CD, and FG loops in the monobody structure (PDB: 1TTG) are shown in orange. (B) NDP52 KO HeLa cells expressing Parkin, mt-Keima, and YFP or YFP-tagged monobodies (MonoB) were treated with antimycin A and oligomycin (AO) for 5 h and analyzed by FACS. Representative FACS data with the percentage of cells exhibiting lysosomal positive mt-Keima are shown. (C) Mitophagy rate (percentage of cells having lysosomal positive Keima) in (B) were quantified. Error bars represent mean ± s.d. of four independent experiments. (D) Mitophagy rate (percentage of cells having lysosomal positive Keima) using OPTN KO HeLa cells were quantified. Error bars represent mean ± s.d. of four independent experiments. (E) NDP52 KO HeLa cells expressing Parkin and YFP or YFP-tagged MonoB were analyzed by immunoblotting (IB). (F) The cells in (E) were co-immunoprecipitated (co-IP) using GFP-Trap. The bound fractions were analyzed by IB. (G) Recombinant GST-OPTN (26–196 aa, 26–119 aa, or 133–196 aa) were incubated with recombinant MonoB. The glutathione sepharose bound fractions were analyzed by CBB staining. (H) Recombinant GST-TBK1 (677–729 aa) and MonoB were incubated with either recombinant GFP or OPTN (26–196 aa)-GFP. GST-TBK1 (677–729 aa) was pulled down with glutathione sepharose and the bound fractions were analyzed by CBB staining. (I) The levels of OPTN (26–196 aa)-GFP pulled down with GST-TBK1 (677–729 aa) in (H) were quantified. The level of OPTN (26–196 aa)-GFP pulled down without MonoB was set to 100. Error bars represent mean ± s.d. of three independent experiments. Data information: n.s. not significant, *P < 0.05, ***P < 0.001 by two-tailed Dunnett’s test (C,D,I). Source data are available online for this figure.

