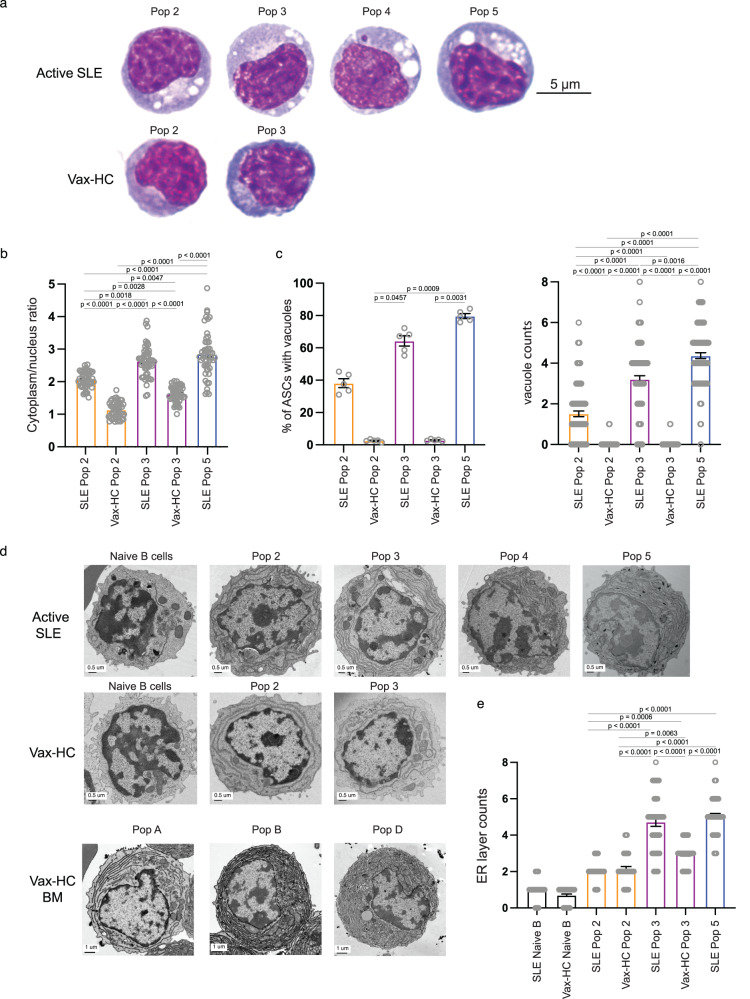
Fig. 4. Peripheral SLE ASC display enhanced mature morphology.
a–c Wright-Giemsa staining of FACS-sorted peripheral ASC populations from active SLE patients (n = 5) and influenza vaccinated heathy subjects on day 7 post immunization (n = 5). a Representative images of Wright-Giemsa staining of the 100X magnification of ASC. The ratio of cytoplasm to nucleus (n = 50) (b), the percentage of ASC populations with vacuoles in each subject (n = 5), and the vacuoles in each cell (n = 100) was evaluated (c). Data are shown as mean ± SEM. Statistical significance was assessed by Kruskal-Wallis test with multiple comparisons using Dunn’s test among all groups (b, c). d–e Electron microscopy of ASC populations sorted from influenza vaccinated heathy subjects and active SLE patients. Representative images (d) and compiled data for density of ER layers (n = 50) (e) in circulating ASC. Images of mature bone marrow PCs from vaccinated heathy subjects were also included for reference (d). Data are shown as mean ± SEM. Statistical significance was assessed using Kruskal–Wallis test with multiple comparisons performed by Dunn’s test among all groups excluding Naive B-cell groups (e). p values are shown on plots. Source data are provided as a Source Data file.

