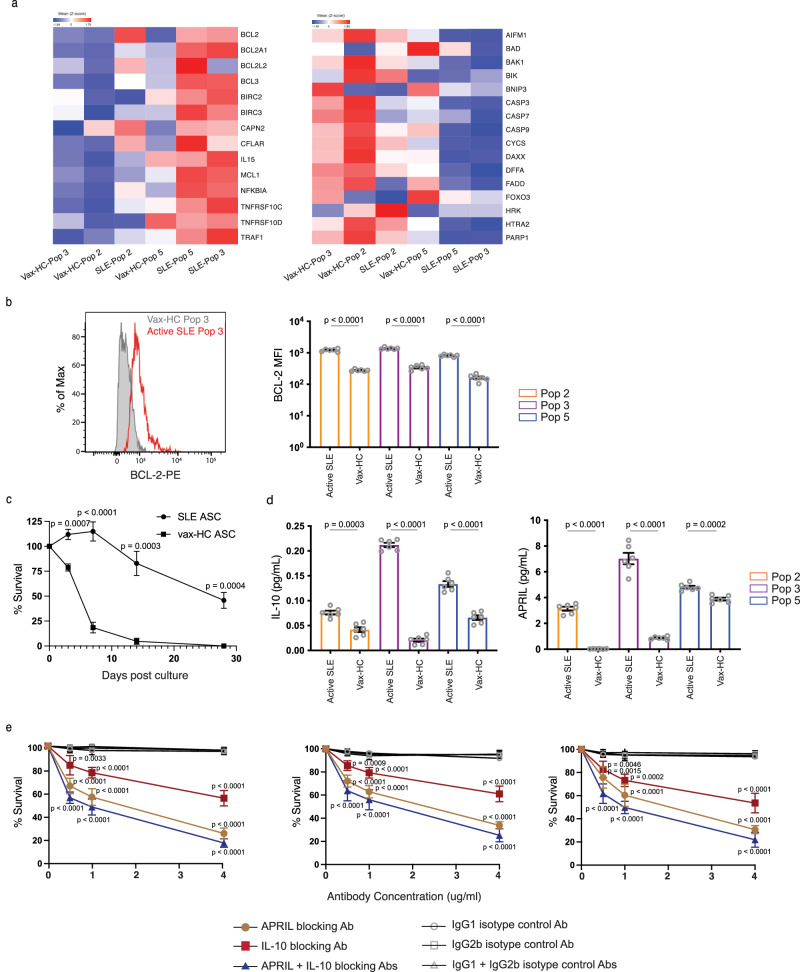
Fig. 7. SLE ASC Express a pro-survival transcriptome and enhanced intrinsic and extrinsic in vitro survival.
a Heatmap of z-score normalized RPKM expression for anti-apoptotic genes (left) and pro-apoptotic genes (right) in ASC Pops from SLE and healthy subject post vaccination. Data represent the mean expression for each group. b BCL-2 protein expression on ASC populations from SLE (n = 6) and vaccinated HC (n = 6) by intracellular flow cytometry is shown in a representative example (left) and compiled data (right). Data are shown as mean ± SEM. Statistical significance was assessed using Student’s t test among disease groups within the same ASC population. c Survival differences determined by SLE ASC intrinsic properties were ascertained using cultures of sorted CD19+ ASC from SLE (n = 5) and post-vax HC (n = 5) in MSC media in the absence of exogenous APRIL, IL-10 or other cytokines. In vitro ASC survival was measured on day 0, 3, 7, 14 and 28 post culture by IgG ELISpot and normalized to the IgG ELISpot numbers of sorted ASC prior to culture. Data are shown as mean ± SEM. Statistical significance was assessed using Student’s t test between SLE patients and vaccinated healthy subjects. d Sorted ASC Pops 2, 3, and 5 from active SLE (n = 6) and post-vax HC (n = 6) were cultured in MSC media, and the supernatant harvested on day 3 to detect the secretion of IL-10 and APRIL by ELISA and normalized to the ELISpot numbers of each population on day 3. Data are shown as mean ± SEM. Statistical significance was performed using Student’s t test within the same ASC population. e Sorted ASC Pops 2, 3, 5 from active SLE (n = 5) were cultured in MSC media with neutralizing antibody against IL-10, APRIL, or both, or their corresponding isotype controls at concentrations of 0.5 ug/ml, 1 ug/ml and 4 ug/ml, and cell survival was measured by IgG ELISpot on day 3, normalized to ASC cultured in the absence of antibodies, and compared with corresponding isotype controls. Data are shown as mean ± SEM. Statistical significance was assessed using Student’s t test between neutralizing antibodies and their corresponding isotype controls at the same concentration. p values are shown on plots. Source data are provided as a Source Data file.

