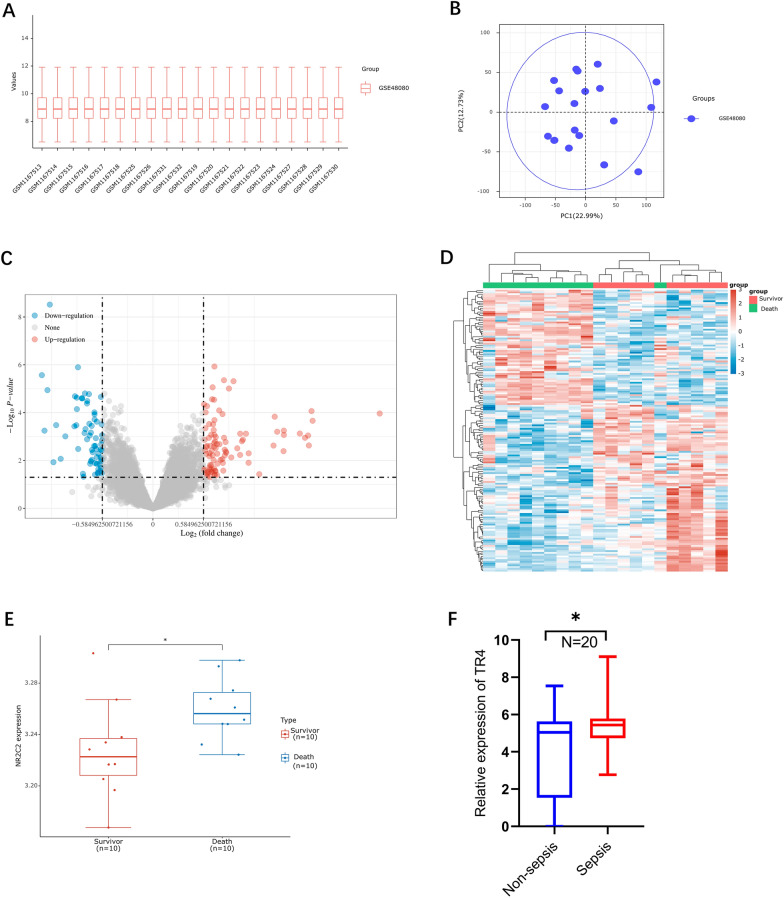
Fig. 2.
TR4 is associated with the sepsis prognosis. A Normalize the gene expression values of different samples by log2 transformation. B Principal component analysis (PCA) was performed on different samples. C Volcano plot of differentially expressed genes; red dots represent upregulated genes and blue dots represent downregulated genes. The fold change was set as ≥ 2 or ≤ 0.5, p < 0.05. D Heatmap of the top 50 differentially expressed genes. E Expression of TR4 in the sepsis survival and death groups. N = 10, *p < 0.05. F Relative mRNA expression of TR4 in the sepsis and nonsepsis groups. N = 20, *p < 0.05

