Fig. 3.

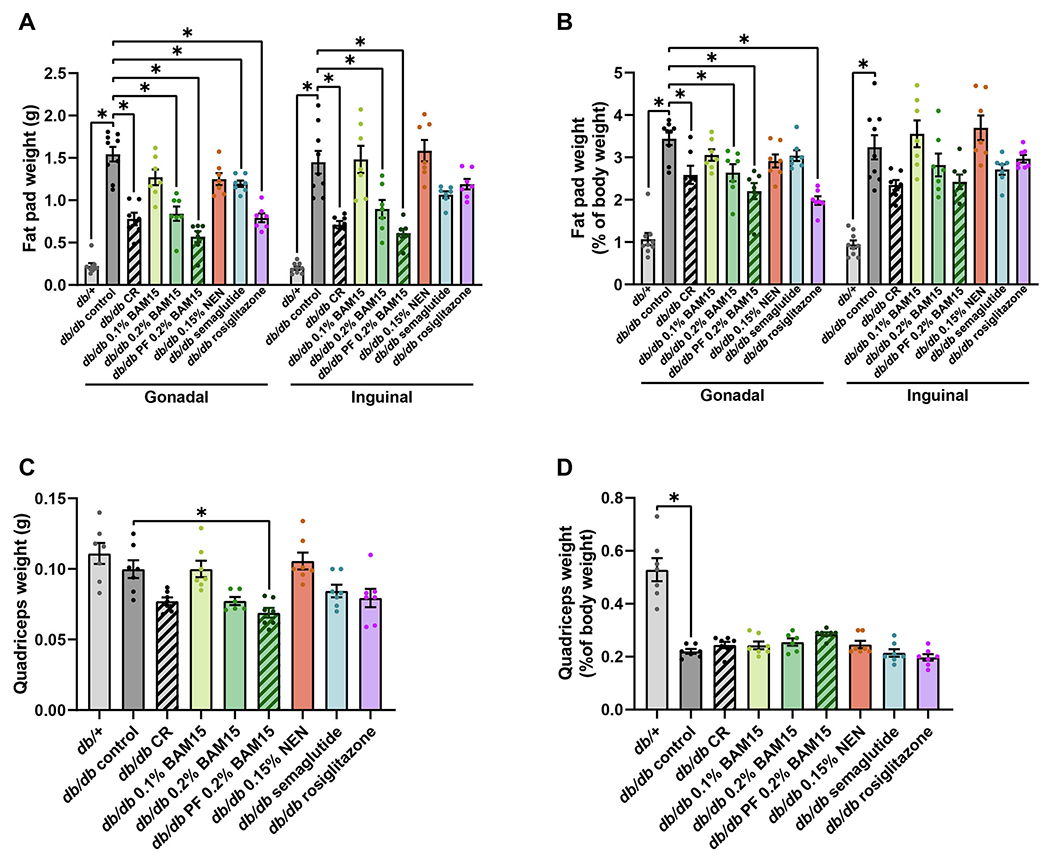
Tissue wet weights in female db/+ and db/db mice after 4 weeks of treatment. Weights of single gonadal and inguinal fat pads (A) and relative fat pad weight normalised to body weight (B). Quadriceps mass as absolute weights (C) and normalised to body weight (D). Statistical significance was analysed by One-Way ANOVA with Tukey’s multiple comparisons test, comparing each group to every other group. Only significant changes (p < 0.05) compared to db/db control are shown, indicated by *. Graphs show mean ± SEM. n = 6–9 mice per group.
