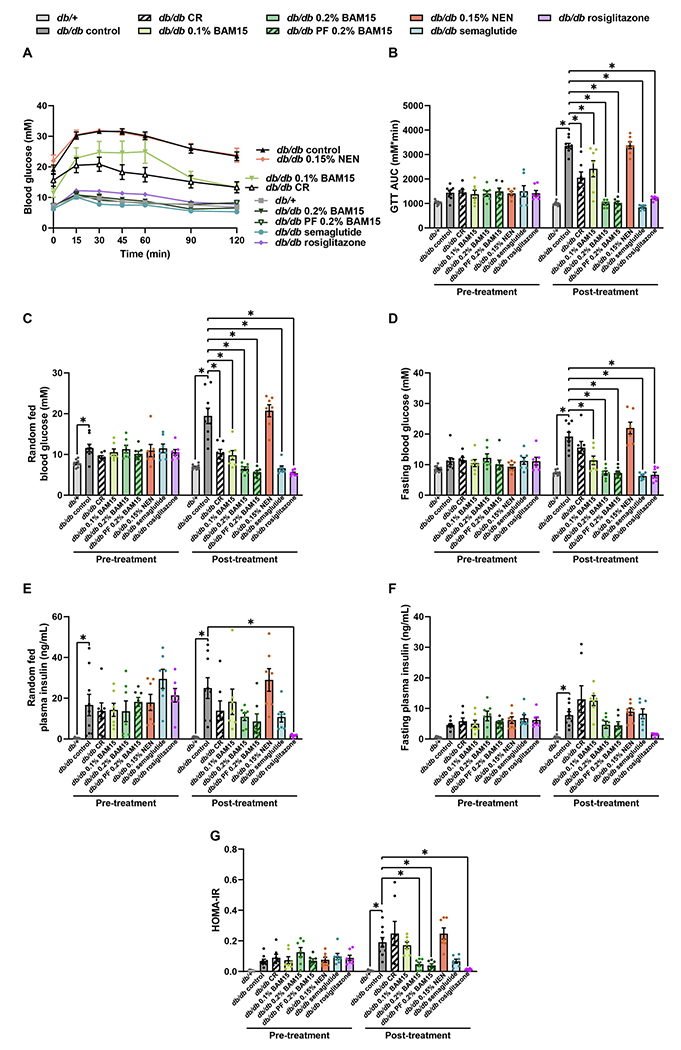
Fig. 4.

Glucose tolerance, blood glucose and plasma insulin levels in female db/+ and db/db mice after 4 weeks of treatment. Glucose tolerance curve (A) and area under the curve (AUC) (B). Random-fed (C) and fasting (D) blood glucose concentrations. Random-fed (E) and fasting (F) plasma insulin concentrations. Calculated HOMA-IR (G). Statistical significance was analysed by One-Way ANOVA with Tukey’s multiple comparisons test, comparing each group to every other group. Only significant changes (p < 0.05) compared to db/db control are shown, indicated by *. Graphs show mean ± SEM. n = 7–9 mice per group.
