FIGURE 2.

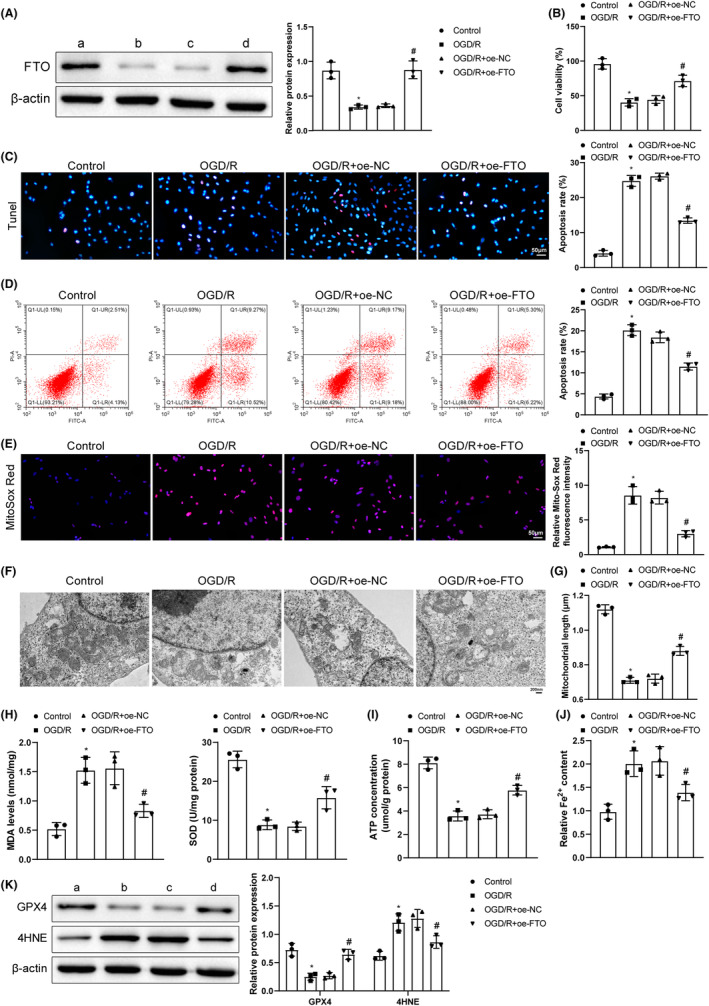
Overexpression of FTO reduces mitochondrial fission and ferroptosis and cell apoptosis in OGD/R cells. (A) Western blot measurement of FTO expression; (B) CCK‐8 detection of cell viability; (C) TUNEL observation of cell apoptosis; (D) Flow cytometry to detect cell apoptosis; (E) Mito‐Sox fluorescence probe determination of ROS generation; (F) TEM observation of mitochondrial conditions; (G) Mitochondrial length; (H) ELISA testing of MDA and SOD expression levels; (I) ATP detection kits of ATP levels; (J) Iron detection kits of Fe2+ content; (K) Western blot analysis of GPX4 and 4HNE expression. *p < 0.05 versus the control group, # p < 0.05 versus the OGD/R + oe‐NC group. These values were measurement data and presented as mean ± standard deviation. Kruskal–Wallis test was adopted for data comparisons among multiple groups. The experiment was repeated thrice.
