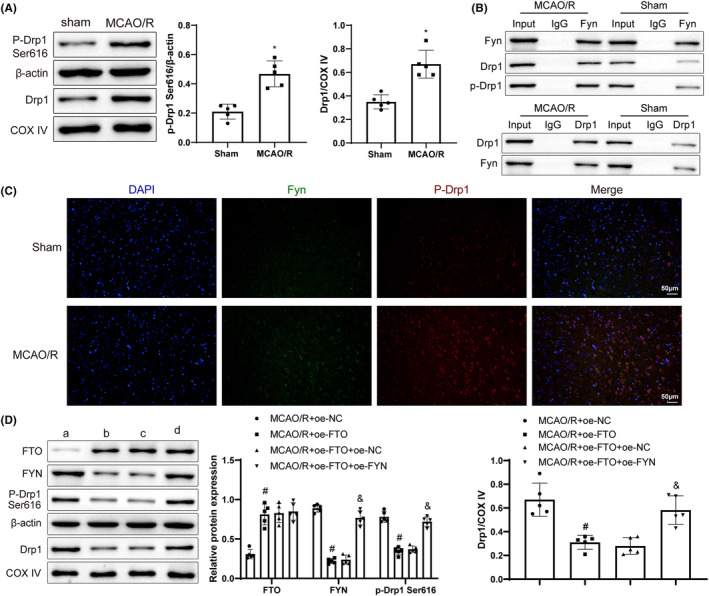
FIGURE 5.

FTO upregulation represses FYN expression and Drp1 phosphorylation to inhibit the activation of Drp1 pathway. (A) Western blot to measure p‐Drp1 Ser616 and mitochondrial Drp1 levels; (B) Co‐IP to test the interaction between FYN and Drp1; (C) Immunofluorescence to detect FYN and p‐Drp1 Ser616 levels; (D) Western blot to measure FTO, FYN, p‐Drp1 Ser616, and mitochondrial Drp1 levels. *p < 0.05 versus the sham group, # p < 0.05 versus the MCAO/R + oe‐NC group, & p < 0.05 versus the MCAO/R + oe‐FTO + oe‐NC group. These values were measurement data and presented as mean ± standard deviation. Unpaired t‐test or Mann–Whitney test was adopted for data comparisons between two groups. One‐way ANOVA or Kruskal–Wallis test was adopted for data comparisons among multiple groups. N = 5.
