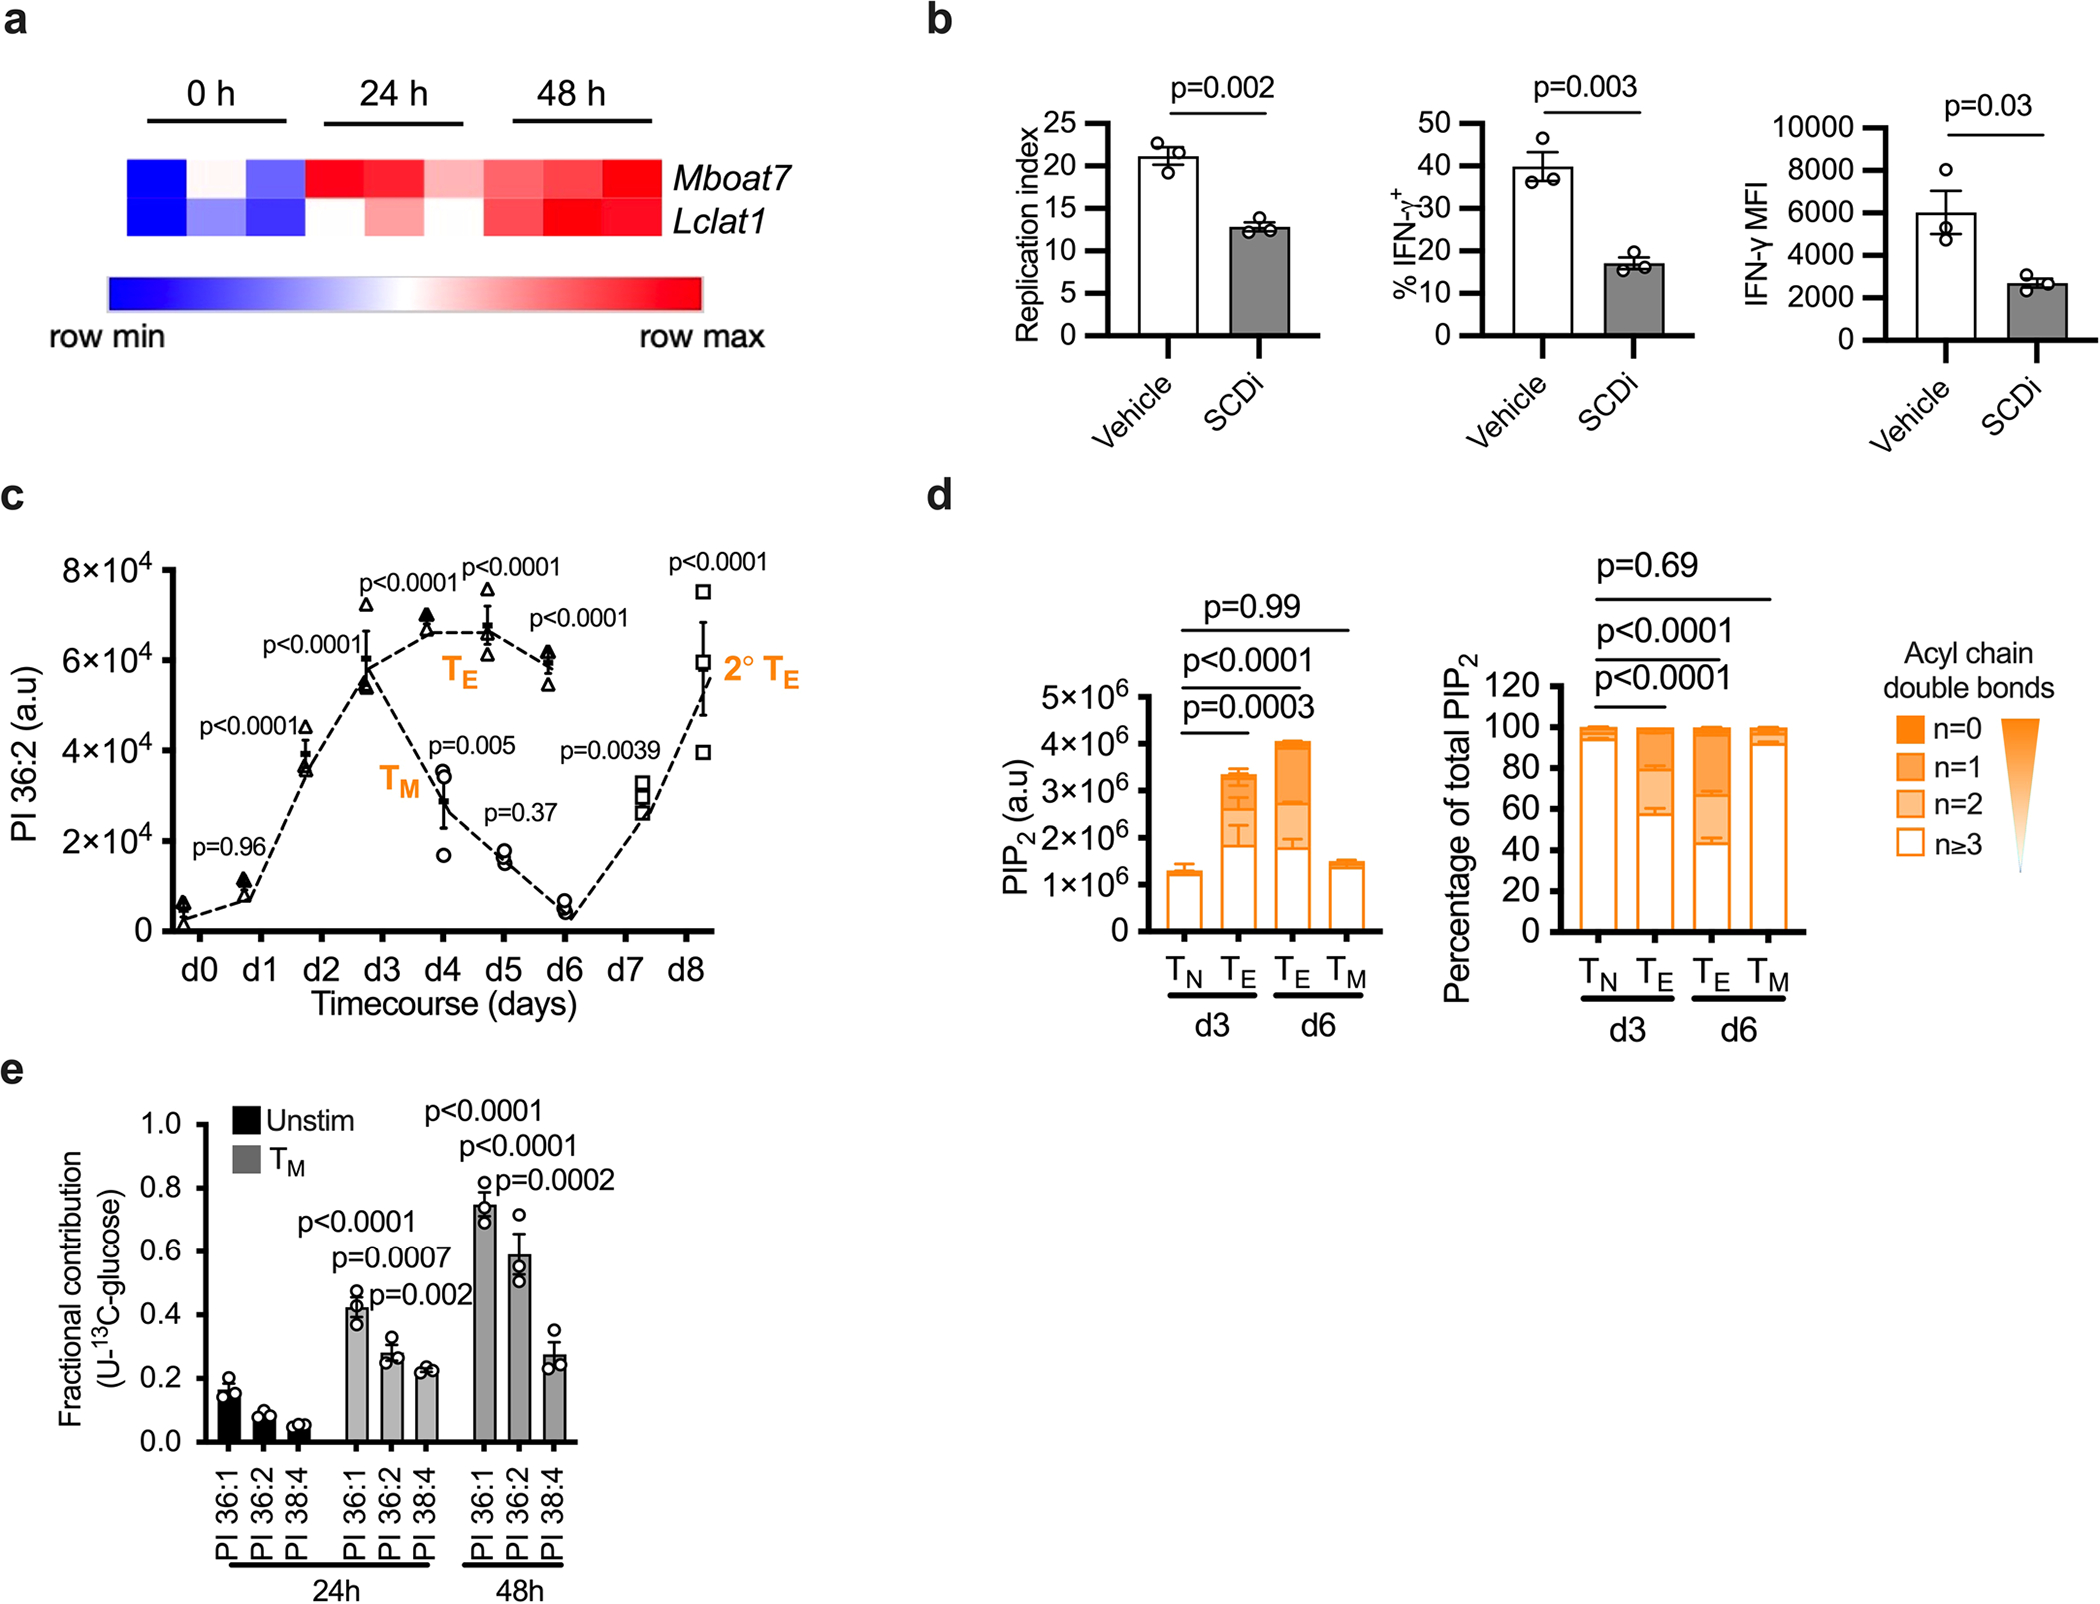
Extended Data Fig. 5 |. TE PIPn synthesis depends on glycolytic metabolism.

a, WT CD8+ T cells were isolated from spleens and lymph nodes of C57BL/6 mice then stimulated with plate-bound anti-CD3 (5 μg/ml), soluble anti-CD28 (0.5 μg/ml) and IL-2 (100 U/ml) for 2 days. Samples for RNA sequencing were harvested every 24 h. Heatmap depicting the gene expression levels of Lclat1 and Mboat7 in n = 3 biologically independent samples. b, WT CD8+ T cells were isolated and activated as in (a), followed by a treatment for 24 h with the Stearoyl-CoA-desaturase inhibitor A939572 (SCDi, 100 nM) in the presence of IL-2. Left panel: Replication Index based on Cell Trace Violet dilution calculated using FlowJo software. Middle and right panel: intracellular expression of IFN-γ. Cells were gated on Live/Dead-IR−, CD8-APC+. n = 3 biologically independent samples; unpaired two-tailed t-test. c, d WT CD8+ T cells were isolated and activated as in (a), followed by culture in IL-2 for 24 h. On d3, cells were either switched to IL-15 (100 U/ml, TM) or maintained in IL-2 until d6. TM were re-activated on d6 by stimulation with plate-bound anti-CD3 (5 μg/ml), soluble anti-CD28 (0.5 μg/ml) and IL-2 (100 U/ml) for 2 days to generate secondary TE. c, Relative amount of PI 36:2 measured every 24 h. n = 3 biologically independent samples; one-way ANOVA corrected for multiple comparisons (Dunnett test) compared all groups to 0 h timepoint. d, Saturation of acyl chains expressed as a proportion of total PIP2 (left panel) and as a percentage of PIP2 (right panel). Statistical analysis of the saturated PI on n = 5 independent biological samples; one-way ANOVA with Dunnett’s multiple comparisons’s test compared all groups to ‘Tn d3’. e, WT CD8+ T cells were differentiated into TM as in (c), with the addition of 100% U-13C-glucose 24 h before lipid analysis at each timepoint. Unstimulated cells were cultured in IL-7 with 100% U-13C-glucose. Fractional contribution of 13C-glucose-derived carbon to PI species was calculated. n = 3 biologically independent samples, two-way ANOVA with correction for multiple comparisons (Sidak’s test) comparing PI species in each group with the relevant 24 h unstimulated PI. Error bars show the standard error of the mean.
