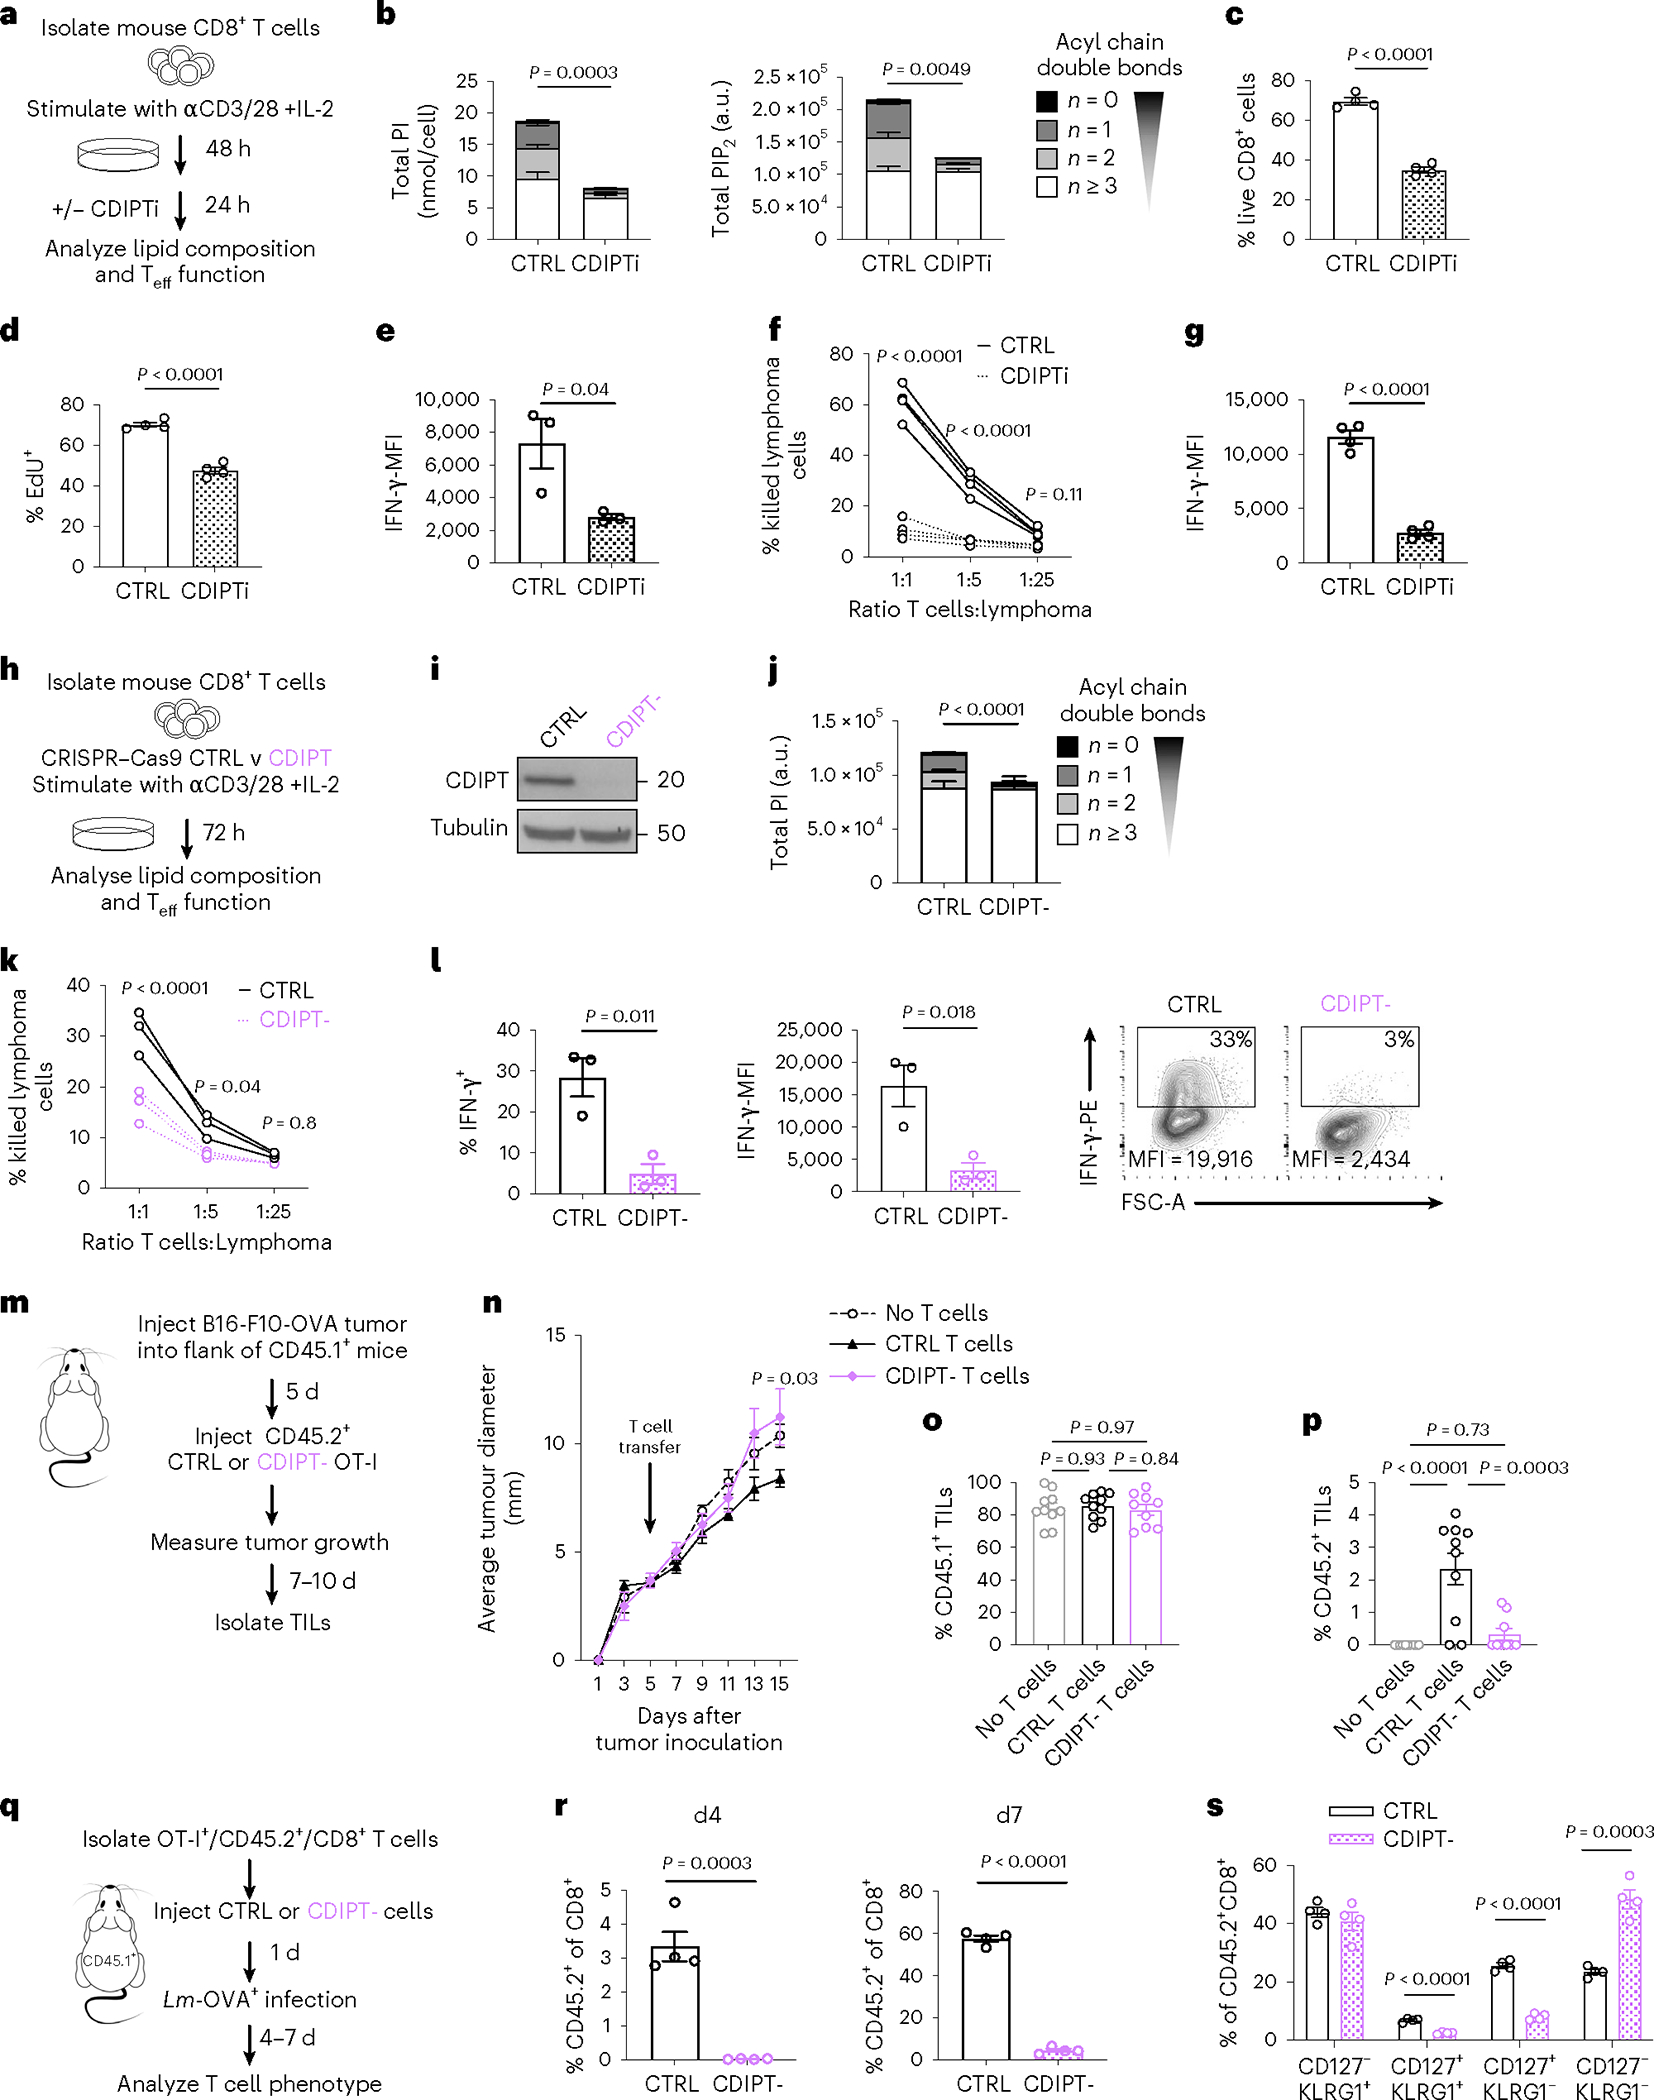
Fig. 2 |. De novo PIPn synthesis is essential for effector T cell fitness and cytotoxic function.

a, Experimental scheme. b, PI (left) or PIP2 (right) acyl chain saturation. n = 4 biologically independent samples, representative of three independent experiments for PI and one experiment for PIP2; unpaired two-tailed t-test comparing saturated PI or PIP2. c, Percentage of live, CD8+ T cells gated on Live/Dead-blue− and CD8-FITC+. d, Incorporation of EdU into newly synthesized DNA. e, Intracellular expression of IFN-γ quantified by flow cytometry. Cells were gated on Live/Dead-IR−, CD8-BV421+. In c–d, n=4 and in e, n = 3 biologically independent samples, representative of three independent experiments; unpaired two-tailed t-test. f,g, OT-I were activated by SIINFEKL peptide with IL-2 for 2 d, treated with CTRL or CDIPTi (plus IL-2), then co-cultured at the indicated ratio with Cell Trace Violet (CTV)-stained EL4-OVA for eight h. f, Percentage killing was determined by CTV+, Live/Dead-IR+ cells. g, Cells co-cultured at a 1:1 ratio in the presence of brefeldin A. IFN-γ expression in Live/Dead-IR− and CD8-APC+ cells. n = 4 biologically independent samples; two-way ANOVA corrected for multiple comparisons (Sidak test) (f) or unpaired two-tailed t-test (g). h, Experimental scheme. i, Protein expression of CDIPT. n = 3 biologically independent samples pooled into a single lane. j, PI saturation. n = 4 biologically independent samples; unpaired two-tailed t-test on saturated PI. k,l, EL4-OVA co-culture as in f and g. n = 3 biologically independent samples; two-way ANOVA corrected for multiple comparisons (Sidak test) (k) or unpaired two-tailed t-test (l). m, Experimental scheme. n, Tumor growth. n = 5 biologically independent samples; two-way ANOVA corrected for multiple comparisons (Dunnett test) comparing no T cell transfer, to transfer of CTRL or CDIPT− T cells at each time point. o,p, Tumors were stained for congenic markers. Cells were gated on LD-Aqua−, CD8-APC-Cy7+ and the percentage of CD45.1-PE-Cy7+ (o) or CD45.2-FITC+ (p) cells is shown. n = 10 represents no T cell transfer and CTRL and n = 9 represents CDIPT− biologically independent samples; one-way ANOVA corrected for multiple comparisons (Tukey test). q, Experimental scheme. r,s, At four and seven d after infection, blood samples from infected mice were analyzed by flow cytometry for the expression of CD8, CD45.1, CD45.2, CD127 and KLRG1. n = 4 biologically independent samples per group; unpaired two-tailed t-test. All error bars show the s.e.m. MFI, mean fluorescence intensity.
