
Fig. 5 |. Effector T cell PIPn synthesis depends on glycolytic metabolism.
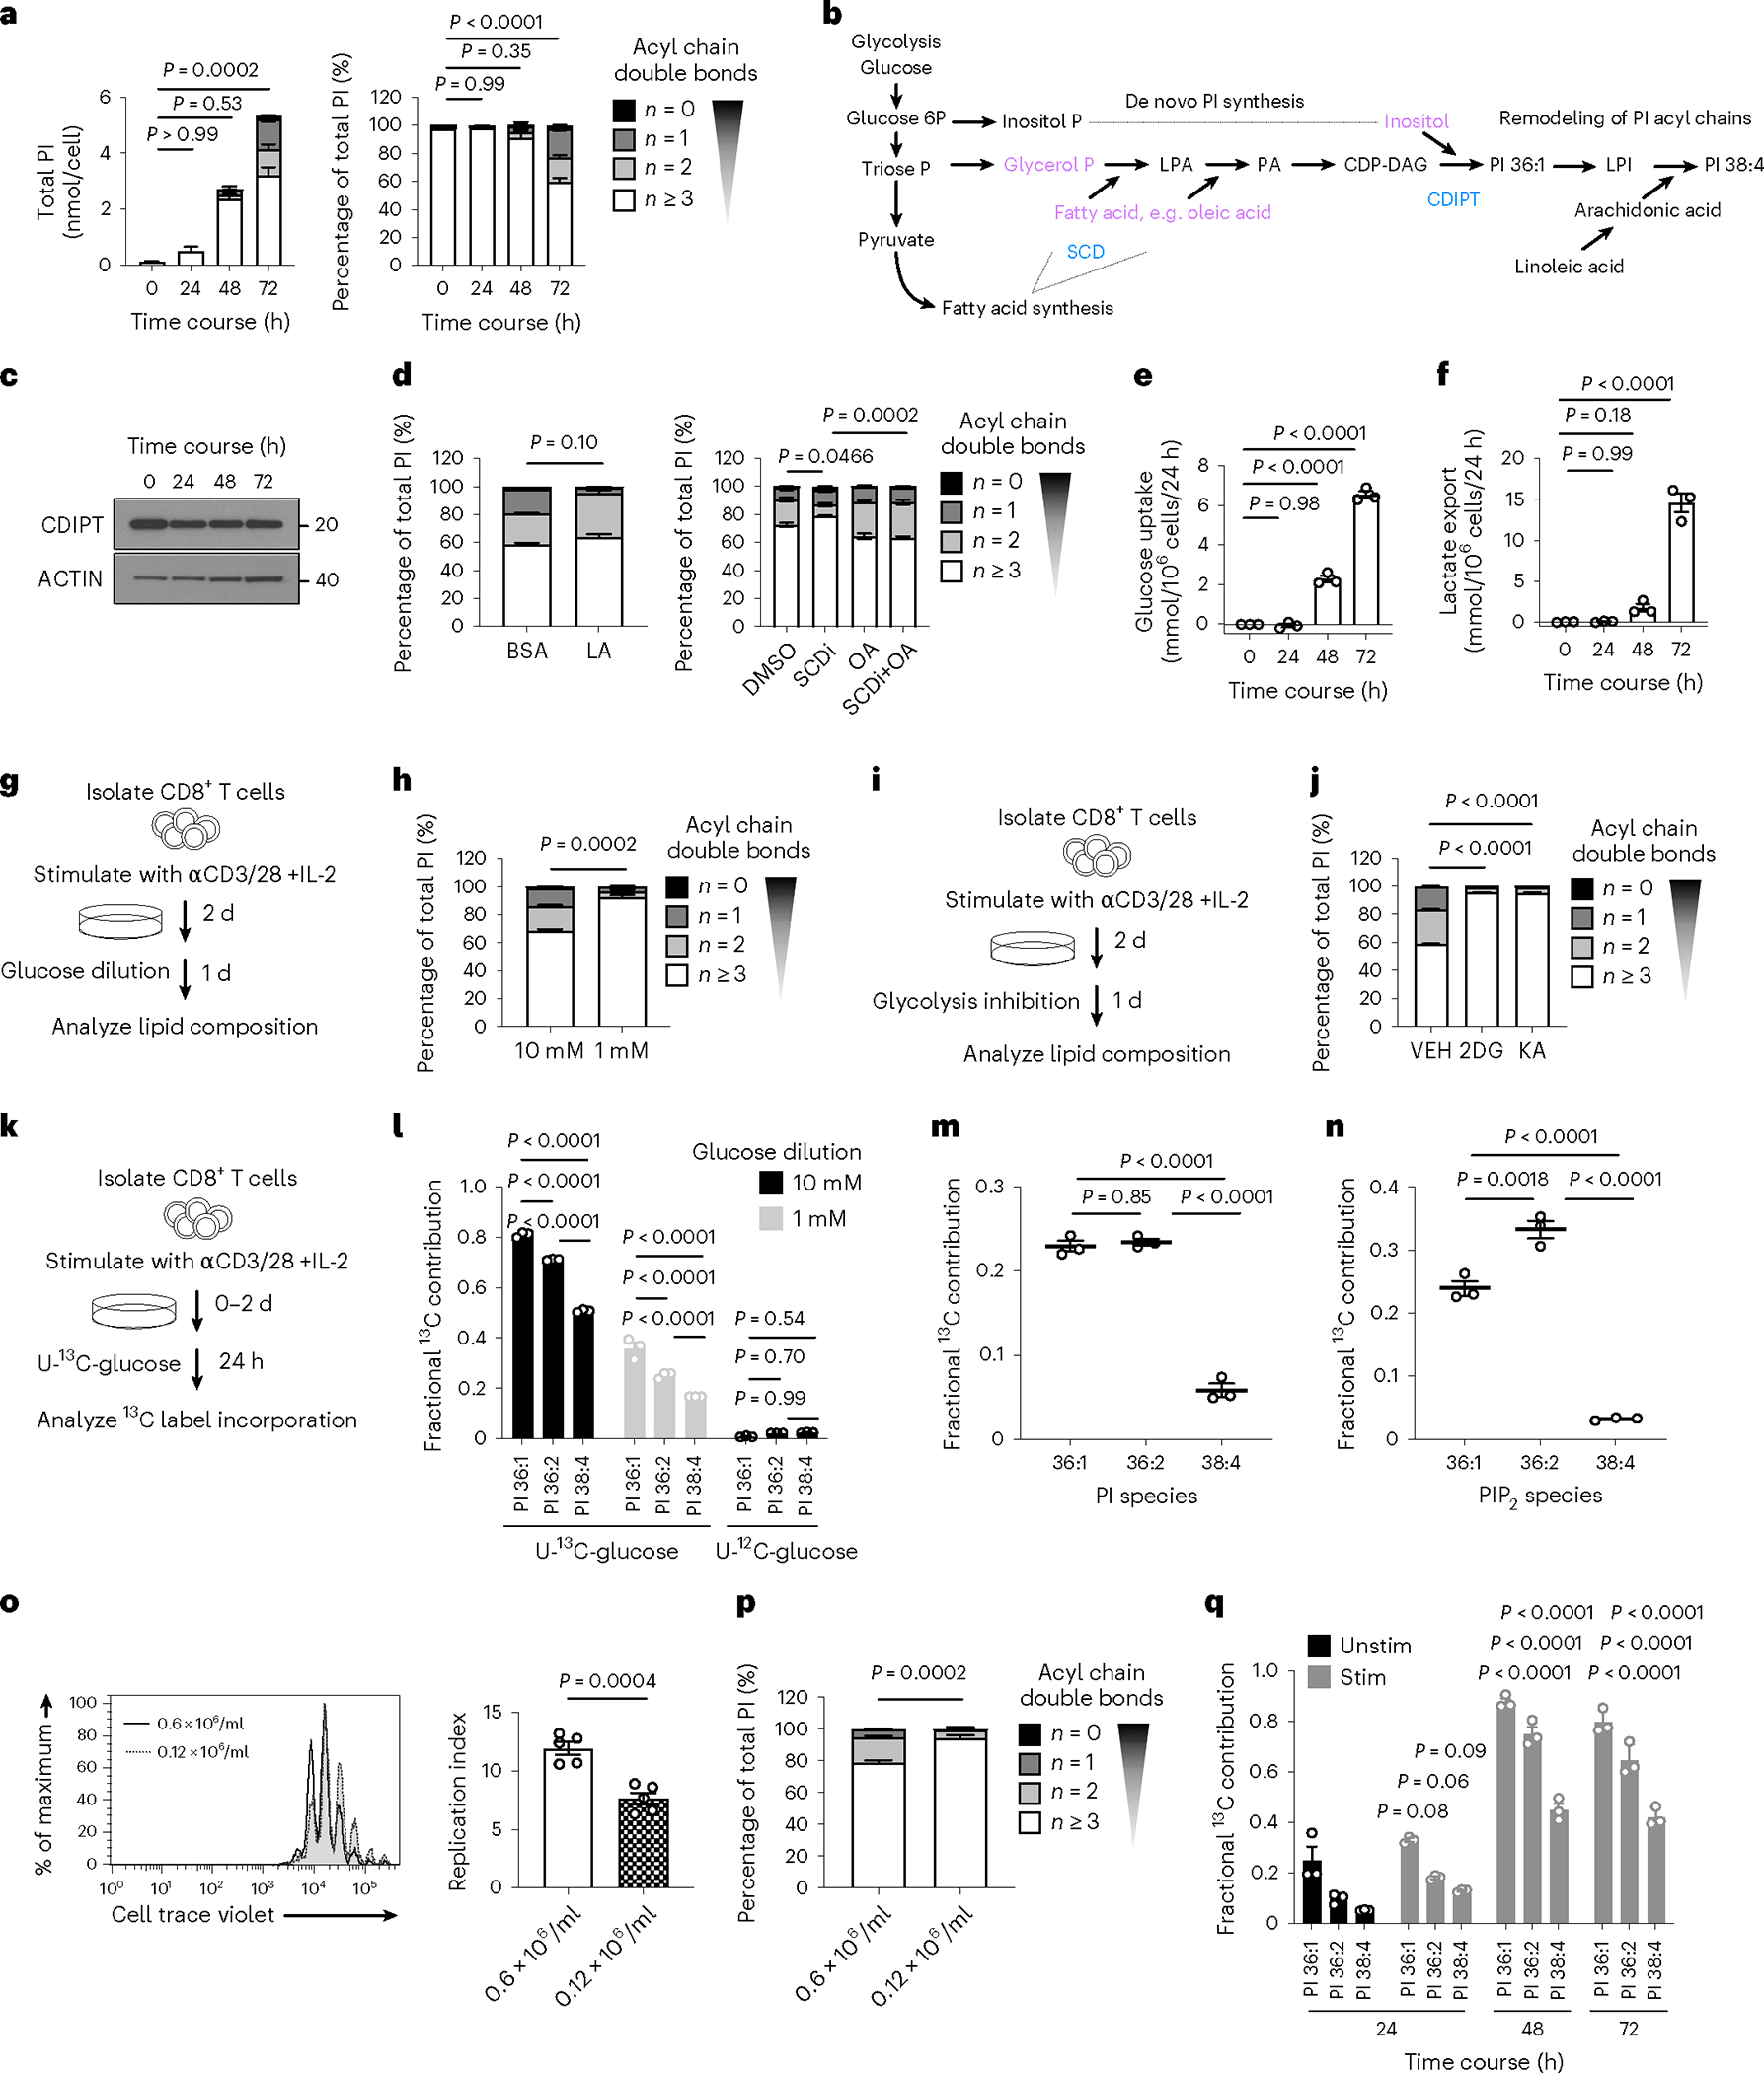
a, PI saturation (left) and percentage PI saturation (right) during WT CD8+ T cell stimulation. n = 3 biologically independent samples representative of 3 independent experiments; one-way ANOVA corrected for multiple comparisons (Dunnett test) comparing saturated PI with the 0 h time point. b, Schematic of de novo PI synthesis. c, Protein expression of CDIPT, as in a. n = 3 biologically independent samples pooled into one sample. d, WT CD8+ T cells were stimulated for 2 d, then for a further 24 h with BSA or BSA-conjugated LA (50 μM; left), or A939572 (SCDi; 100 nM), BSA-conjugated OA (100 μM), or a combination of both (right; plus IL-2), and PI saturation is shown. n = 4 or n = 3 biologically independent samples, respectively; unpaired two-tailed t-test or one-way ANOVA corrected for multiple comparisons (Tukey test) respectively on saturated PI. e,f, Glucose uptake and lactate export respectively, as in a. n = 3 biologically independent samples; one-way ANOVA corrected for multiple comparisons (Dunnett test) comparing each time point with the 0-h time point. g, Experimental schematic. h, Total PI saturation. n = 3 biologically independent samples; unpaired two-tailed t-test on saturated PI. i, Experimental schematic. j, Total PI saturation. n = 3 biologically independent samples; one-way ANOVA corrected for multiple comparisons (Dunnett test) comparing all groups with the vehicle control. k, Experimental schematic. l, Fractional 13C incorporation into major PI species. n = 3 biologically independent samples; two-way ANOVA corrected for multiple comparisons (Sidak test). m,n, As in k with 6-h labeling. Fractional 13C incorporation into major PI (m) or PIP2 (n) species from U-13C-glucose normalized to unlabeled glucose. n = 3 biologically independent samples; one-way ANOVA corrected for multiple comparisons (Tukey test). o,p, WT CD8+ T cells were stained with CTV, activated as in a, and plated at 0.6 × 10⁶ cells/ml or 0.12 × 10⁶ cells/ml. o, Left, CTV dilution after 72 h of activation. Right, replication index. n = 5 biologically independent samples; unpaired two-tailed t-test. p, Total PI saturation. n = 5 biologically independent samples; unpaired two-tailed t-test comparing saturated PI. q, Fractional contribution of 13C-glucose-derived carbon to PI major species as in a, with the addition of 100% U-13C-glucose 24 h before lipid analysis at each time point. n = 3 biologically independent samples; two-way ANOVA corrected for multiple comparisons (Dunnett test) comparing respective PIs within each group with unstimulated cells. Error bars show the s.e.m.