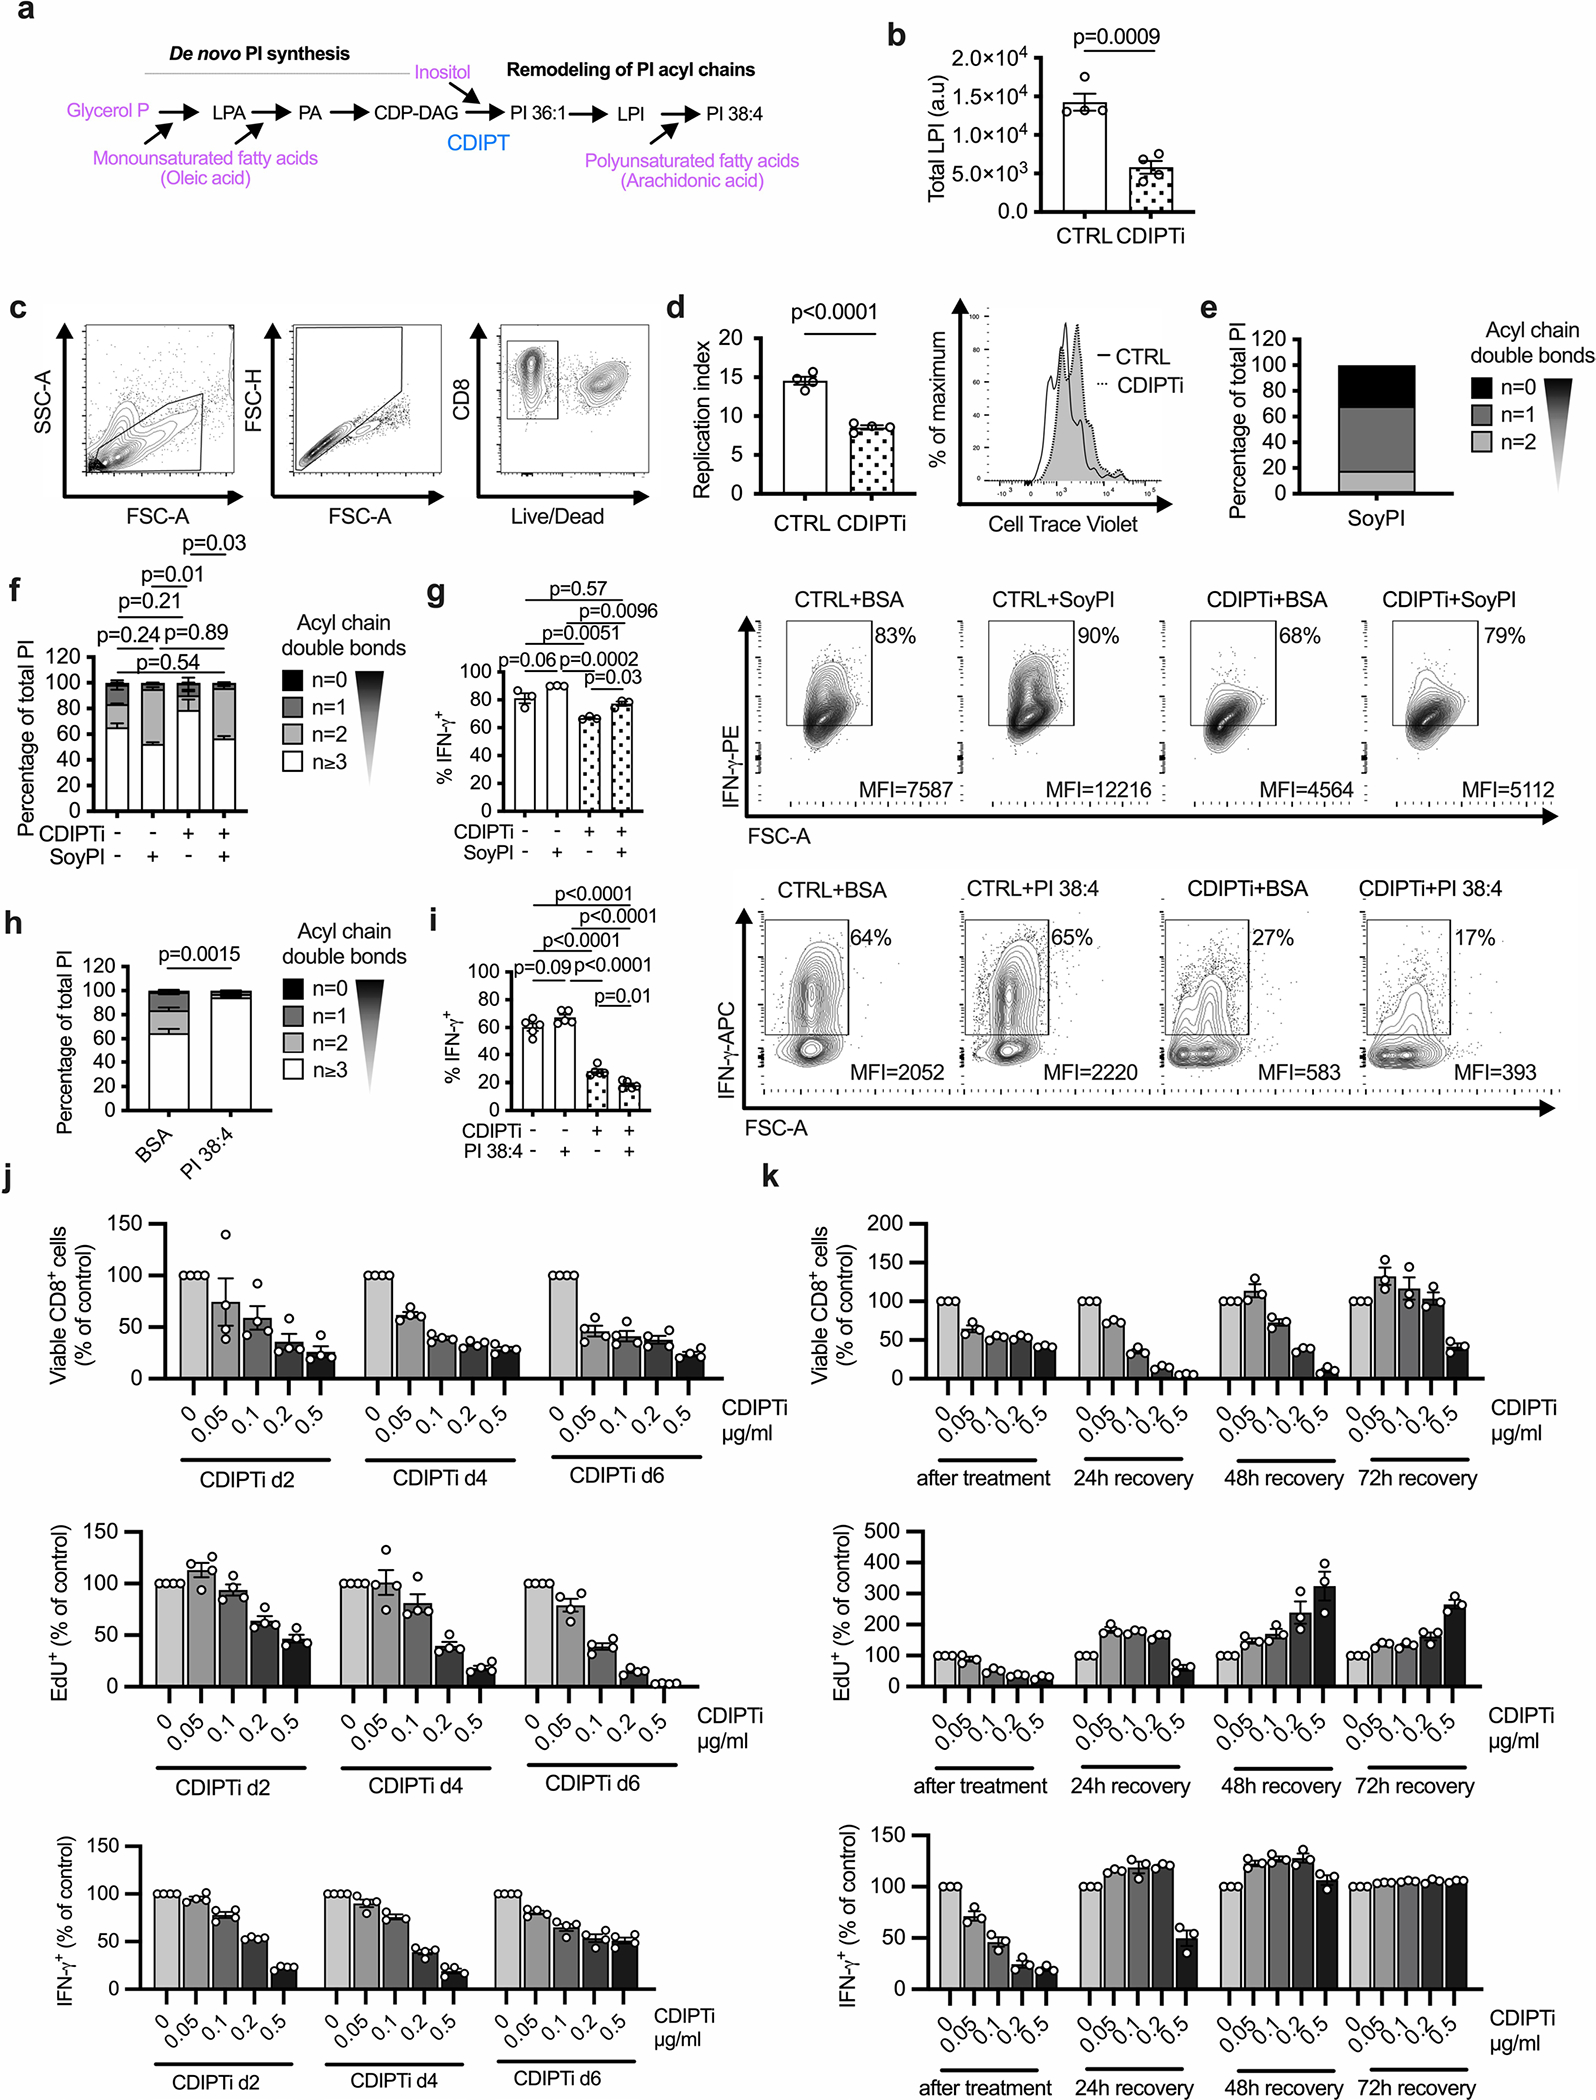
Extended Data Fig. 2 |. CDIPT inhibition or deletion impairs TE fitness and function.

a, Simplified overview of PI de novo synthesis and remodeling. b, WT CD8+ T cells were activated and treated as in Fig. 2a. Total lysophosphatidlyinositol (LPI) content is shown. n = 4 biologically independent samples; unpaired two-tailed t-test. c, Gating strategy for flow cytometry analysis. d, Replication Index based on cell trace violet dilution was calculated using FlowJo software. n = 4 biologically independent samples; unpaired two-tailed t-test. e, PI species present in PI derived from Soy expressed by degree of acyl chain saturation. f-g, Cells were prepared as in (b), with the addition of BSA (10 mg/ml) control or BSA conjugated to Soy-derived PI (SoyPI, 100 μM) for the final day. f, Saturation of acyl chains expressed as a percentage of total PI. n = 3 biologically independent samples, one-way ANOVA corrected for multiple comparisons (Tukey test) comparing saturated PI. g, Percentage IFN-γ+ cells are shown, gated on Live/Dead-aqua− and CD8-Brilliant Violet 421+. n = 3 biologically independent samples; one-way ANOVA corrected for multiple comparisons (Tukey test). h-I, Cells were prepared as in (b), with the addition of BSA (10 mg/ml) control or BSA conjugated to PI 38:4 (100 μM) for the final day. h, Saturation of acyl chains expressed as a percentage of total PI. n = 3 biologically independent samples; unpaired two-tailed t-test comparing saturated PI. I, Percentage IFN-γ+ cells are shown, gated on Live/Dead-near-IR− and CD8-Brilliant Violet 421+. n = 5 biologically independent samples representative of three experiments; one-way ANOVA corrected for multiple comparisons (Tukey test). j, WT CD8+ T cells were activated as in Fig. 2a and the CDIPT inhibitor inostamycin was added at the indicated concentrations for 24 h starting either after either two, four or six days of activation. Upper panel: percentage of viable CD8+ cells. Cells were gated on FSC and SSC and single cells. Middle panel: percentage of EdU+ cells. Cells were gated on Live/Dead-aqua− CD8-APC-Cy7+. Lower panel: percentage of IFN-γ+ cells. Cells were gated on Live/Dead-aqua− CD8-APC-Cy7+. For each time point, the values were normalized to the values of the control samples (0 μg/ml CDIPTi). n = 4 biologically independent samples representative of two independent experiments. k, WT CD8+ T cells were activated and treated as in Fig. 2a. After 24 h of CDIPTi treatment, the cells were cultured in media without CDIPTi for the indicated time intervals. Upper panel: percentage of viable CD8+ cells. Cells were gated on FSC and SSC and single cells. Middle panel: percentage of EdU+ cells. Cells were gated on Live/Dead-aqua− CD8-APC-Cy7+. Lower panel: percentage of IFN-γ+ cells. Cells were gated on Live/Dead-aqua− CD8-APC-Cy7+. For each time point, the values were normalized to the values of the control samples at the respective time point (0 μg/ml CDIPTi). n = 3 biologically independent samples representative of two independent experiments. Error bars show s.e.m.
