
Figure 2. Cell types resolved in A-T and control human cerebellum by snRNA-seq.
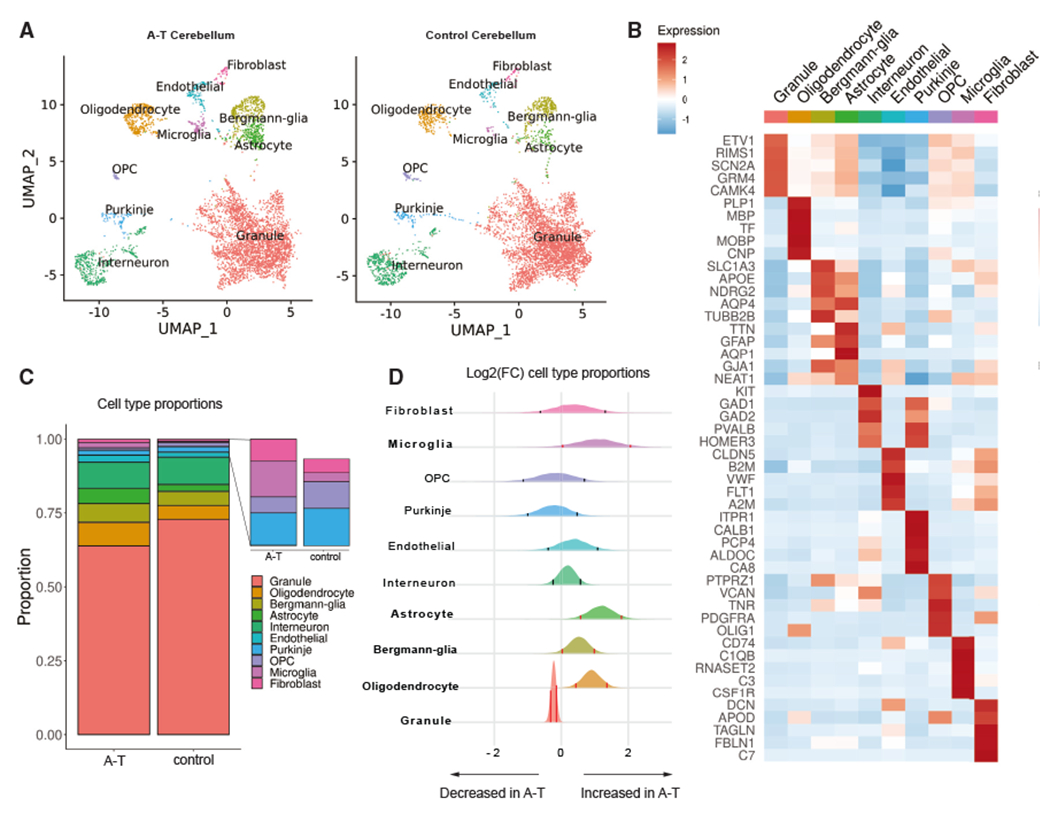
(A) Uniform manifold approximation and projection (UMAP) dimensionality reduction plot of major cell types identified in A-T and control human cerebellum, downsampled to 10,000 cells for each condition.
(B) Top five marker genes for each major cell type in control cerebellum. Heatmap depicts centered and scaled log-normalized expression values.
(C) Cell-type proportions in A-T and control cerebellum.
(D) Relative abundance of cell types in A-T versus control cerebellum, shown as the posterior distribution of log2(proportion in A-T/proportion in control) with 89% credible interval. Red bars highlight credible intervals that do not overlap 0. Bolded cell-type labels indicate a significant difference in relative abundance.