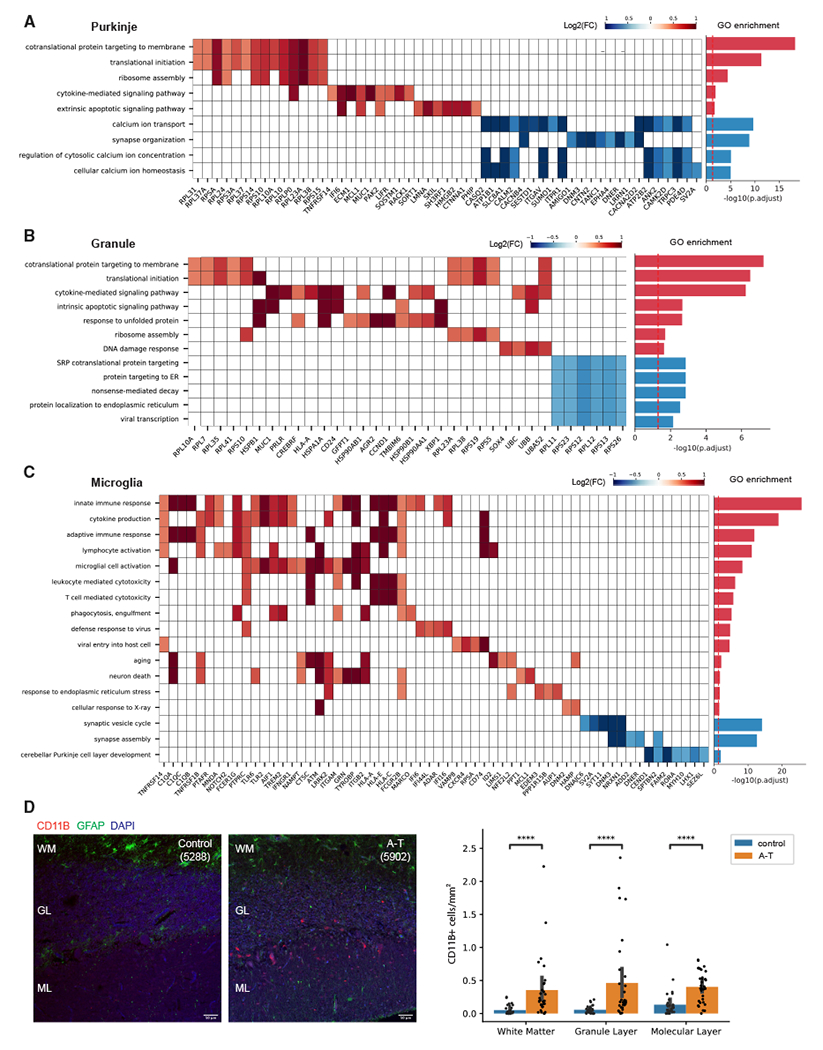
Figure 3. Gene Ontology (GO) analysis of differentially expressed genes in A-T cerebellum.

(A–C) Select enriched GO biological processes among DEGs in (A) A-T Purkinje neurons, (B) granule neurons, and (C) microglia. Select genes in each pathway and their log2 fold changes (A-T/control) shown in the heatmap. Bar plot shows significance of pathway enrichment among upregulated genes (red) and downregulated genes (blue).
(D) CD11B immunostaining of postmortem cerebellar cortex from A-T and control. WM, white matter; GL, granule layer; ML, molecular layer. Quantification of CD11B+ cells across cerebellar cortex layers in A-T and control. Error bar represents 95% confidence interval. ****Bonferroni-adjusted p < 1e—04, Mann-Whitney U test. Scale bar, 50 μm.
