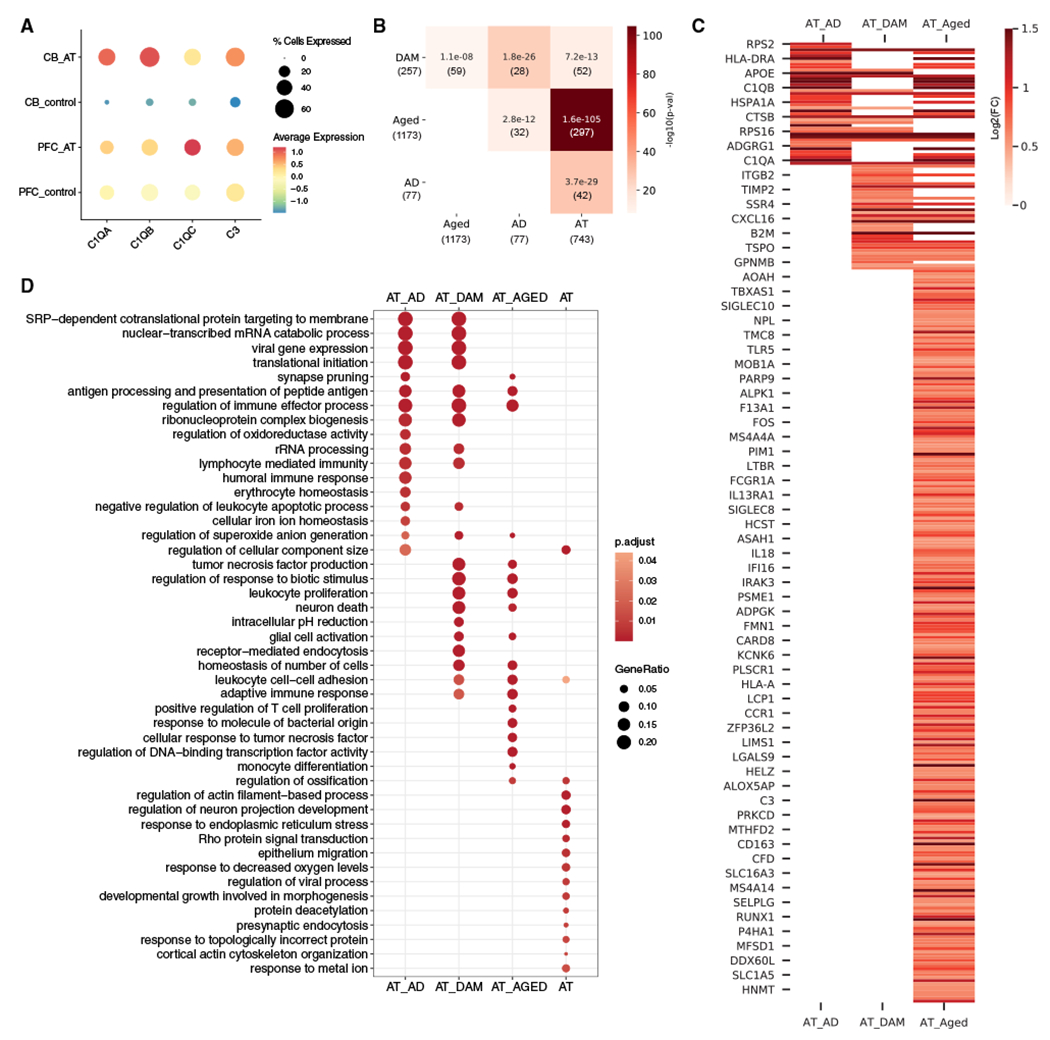
Figure 4. A-T cerebellar microglia share transcriptomic signatures with aging and neurodegenerative microglia.

(A) Average scaled expression of complement components C1QA, C1QB, C1QC, and C3 in microglia from A-T and control cerebellum (CB) and prefrontal cortex (PFC).
(B) Overlap between A-T microglia upregulated genes and human Alzheimer’s disease (AD) microglia markers,38 disease-associated microglia (DAM) markers,40 and human aging microglia markers (Aged).39 Overlap p values from Fisher’s exact test shown in each cell. Color represents —log10(overlap p value). Number of genes in each set and intersection are shown in parentheses.
(C) Heatmap of A-T microglia log2 fold changes (false discovery rate [FDR] < 0.05) for overlapping microglia markers. AT_AD, A-T and Alzheimer’s disease microglia overlapping genes; AT_DAM, A-T and DAM overlapping genes; AT_AGED, A-T and human aging microglia overlapping genes.
(D) GO biological process enrichment of overlapping microglia markers. AT, A-T microglia-only upregulated genes. Pathways with FDR <0.05 shown.
