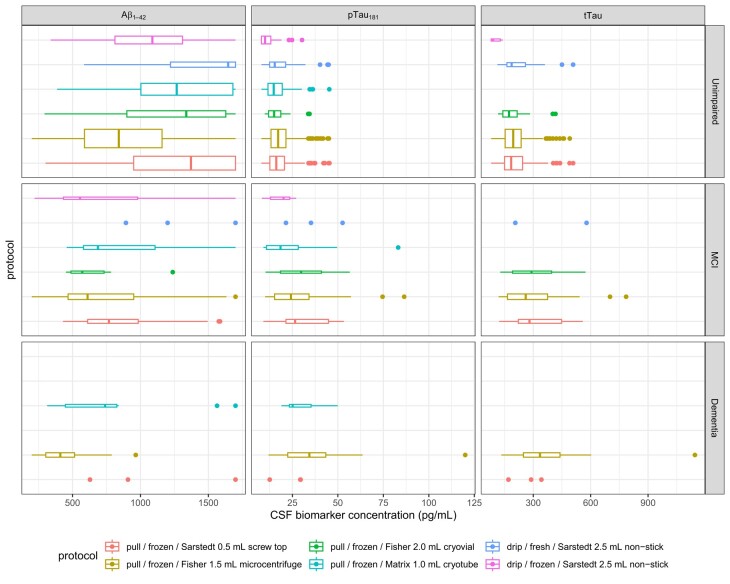
Fig. 2.
Between-subjects estimates of effects of protocol on measured values of , , and tTau, stratified by concurrent cognitive diagnosis.
Each boxplot reflects the median (central line) and two hinges (upper and lower lines, reflecting 25th and 75th percentile), along with whiskers extending from the hinge to the largest value within 1.5 times the interquartile range (IQR) of each hinge. Boxplot widths are proportional to sample size.

