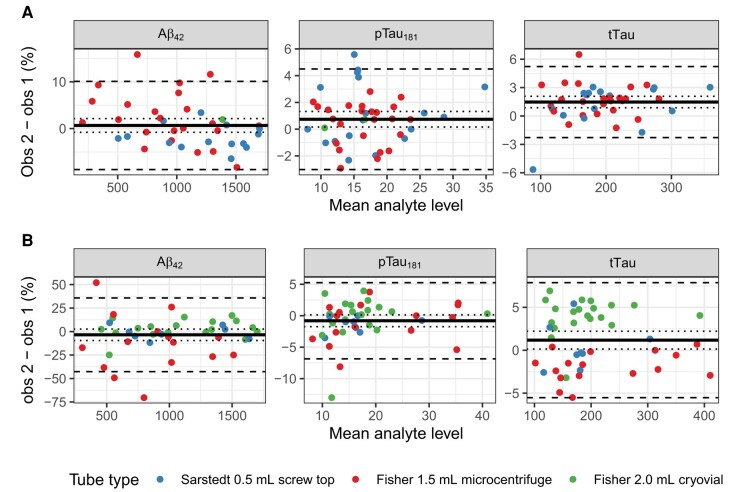
Fig. 3.
Bland–Altman (mean-difference) plots showing repeatability of assays.
Dashed lines represent upper and lower 95% limits of agreement (); dotted lines reflect the 95% confidence interval around the mean difference (). Scatter represents the percentage difference between the first and second measurement plotted against their mean value. (A), Same aliquot, same analysis date; (B), different aliquot from the same lumber puncture, different analysis date.

