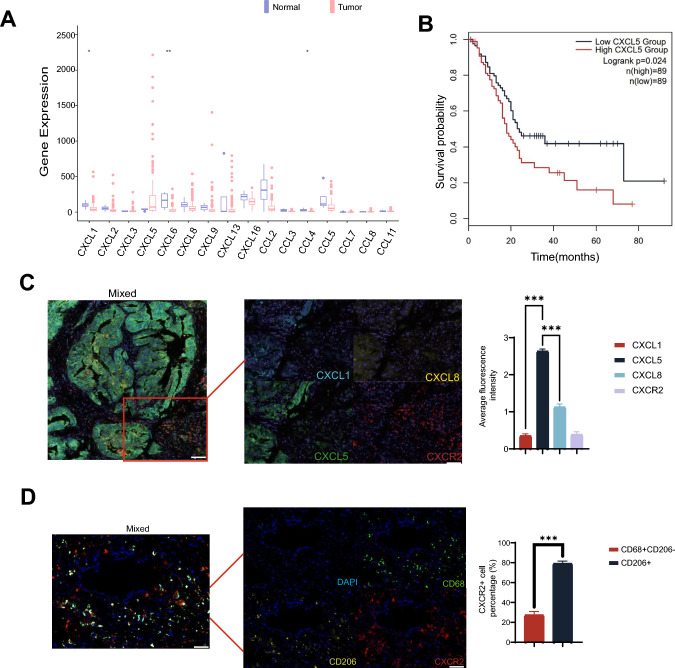
Fig. 1.
Expression of CXCL5 and distribution of CXCR2 + macrophage in PDAC TME. A Chemokine expression in pancreatic tumors and normal tissues was evaluated using data derived from the TCGA database. B Survival of PDAC patients with high and low CXCL5 expression. C Representative images from multiplex fluorescence immunohistochemistry highlight the spatial distribution of CXCL1, CXCL5, CXCL8, and CXCR2 in pancreatic cancer tissue samples. The distribution was analyzed using multiplex fluorescence immunohistochemistry, and fluorescence intensities were determined.Scale bars, 400 μm in Mixed. Scale bars, 100 μm in other figure. D Representative images from multiplex fluorescence immunohistochemistry depict the spatial distribution of CD68, CD206, and CXCR2 in tissue samples from pancreatic cancer patients. The distribution was assessed using multiplex fluorescence immunohistochemistry, and the count of CXCR2 + CD68 + cells was obtained relative to CD206 + cells. Scale bars, 100 μm. Data are expressed as mean ± SEM from triplicate experiments. Statistical significance is indicated as follows: P < 0.05, P < 0.01, **P < 0.001

